

Get visibility into the cost and performance of queries with Fauna Logs
We are thrilled to announce the general availability of Fauna Logs with an initial focus on query performance and insights. Fauna Logs allows users to gather valuable insights about their database systems' performance, behavior, and usage. Read on to learn how you can use this new feature.
Why query performance logs are important
By analyzing database query logs, developers can identify slow-performing queries and bottlenecks and optimize for performance and cost. Additionally, query logs can help debug and diagnose application issues by providing a historical record of executed queries.
Continuous monitoring of query logs also enables developers to identify the most common user queries in the application and gain a deep understanding of their application's most frequently used features.
Accessing Fauna Logs
Access logs through the Fauna Dashboard
The easiest way to access Fauna query logs is through the dashboard user interface. Note that this feature is only available on the Team and Business plans.
Head over to Fauna dashboard. From the dashboard menu select user profile icon and then select settings.
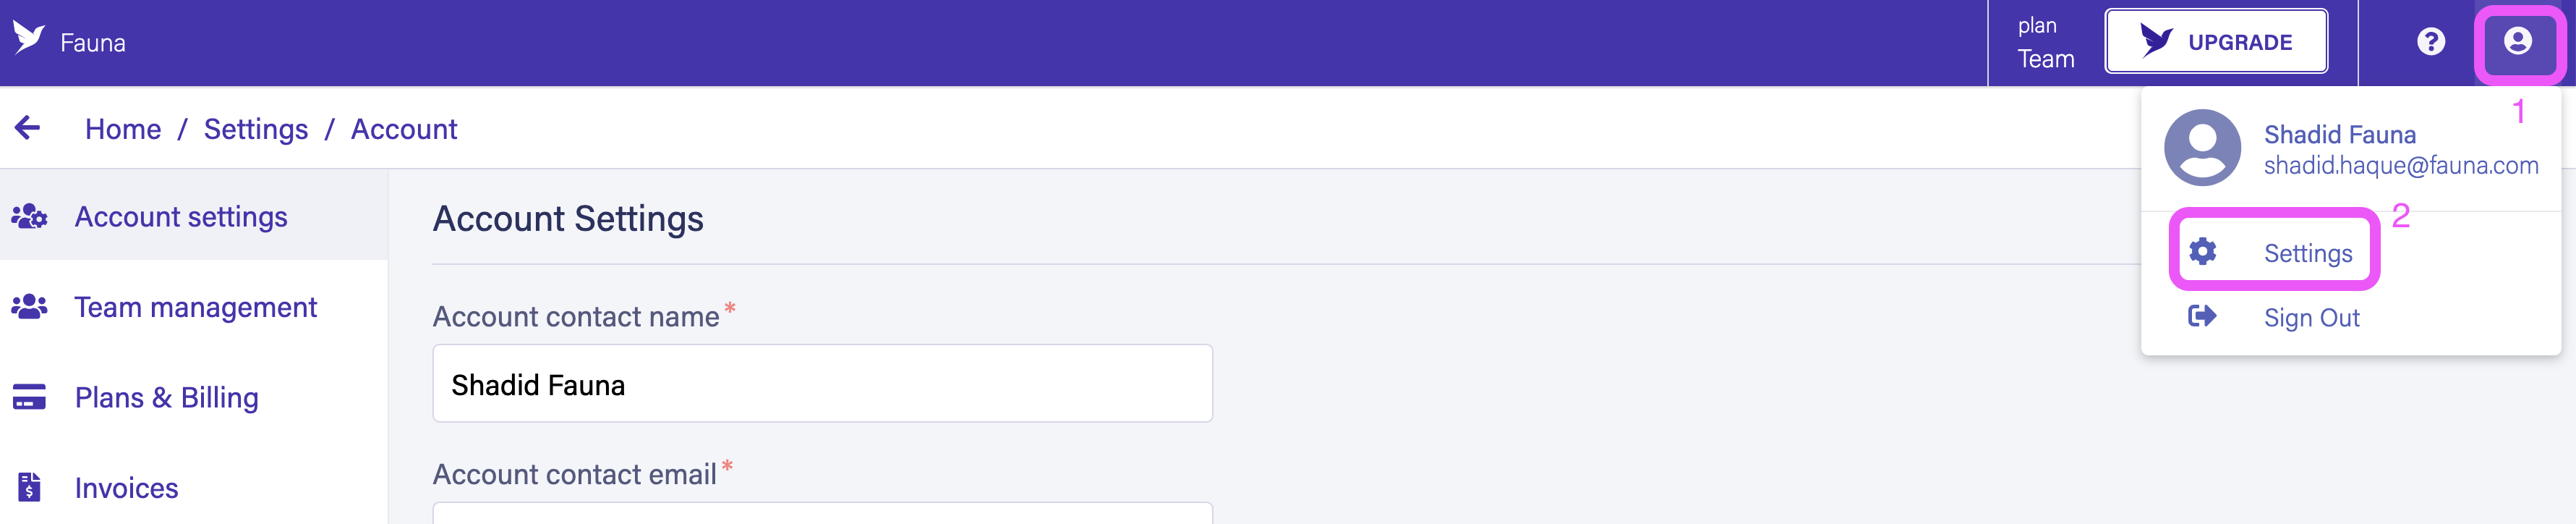
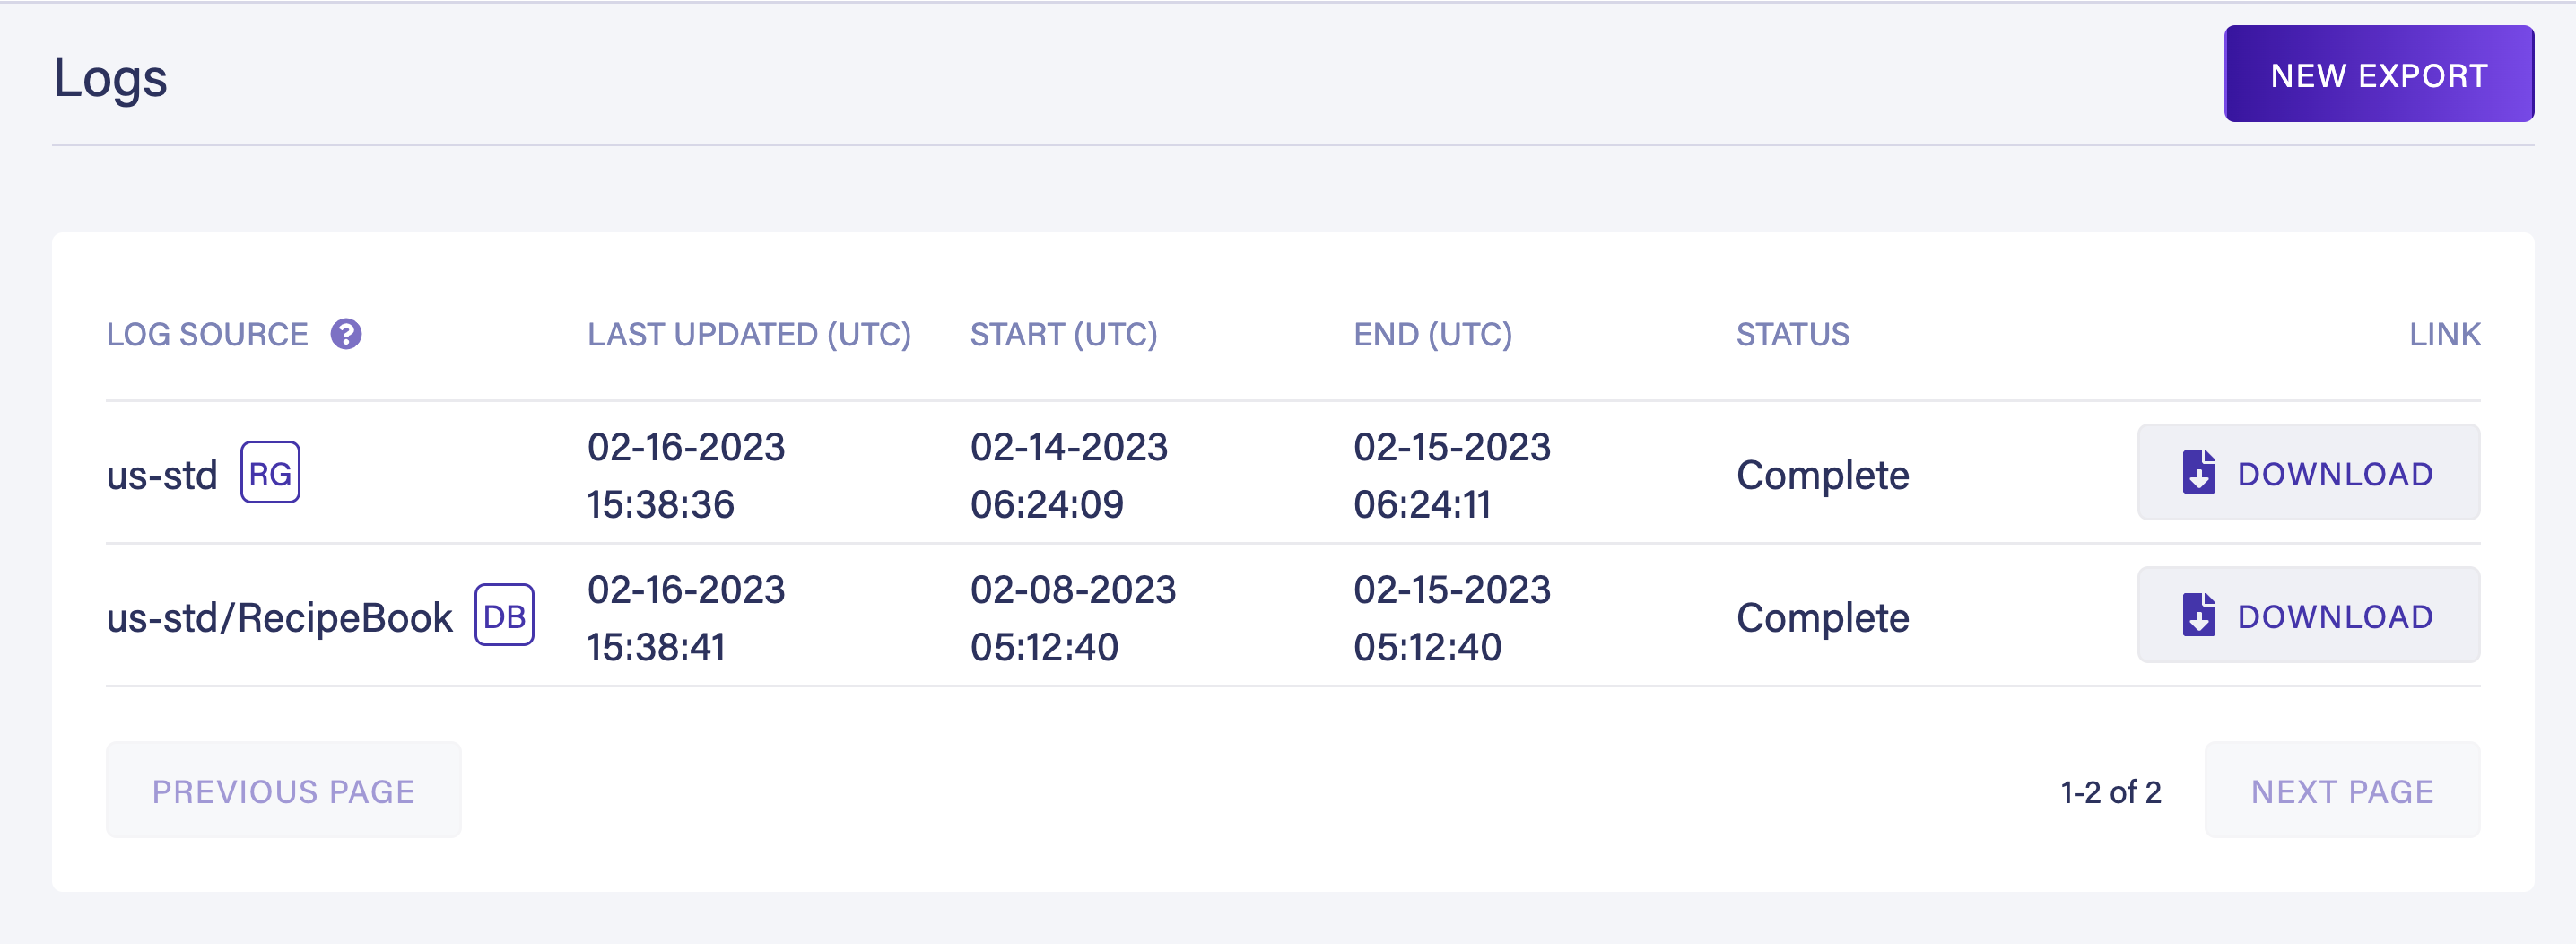
In the account settings menu you have a new option called Logs.
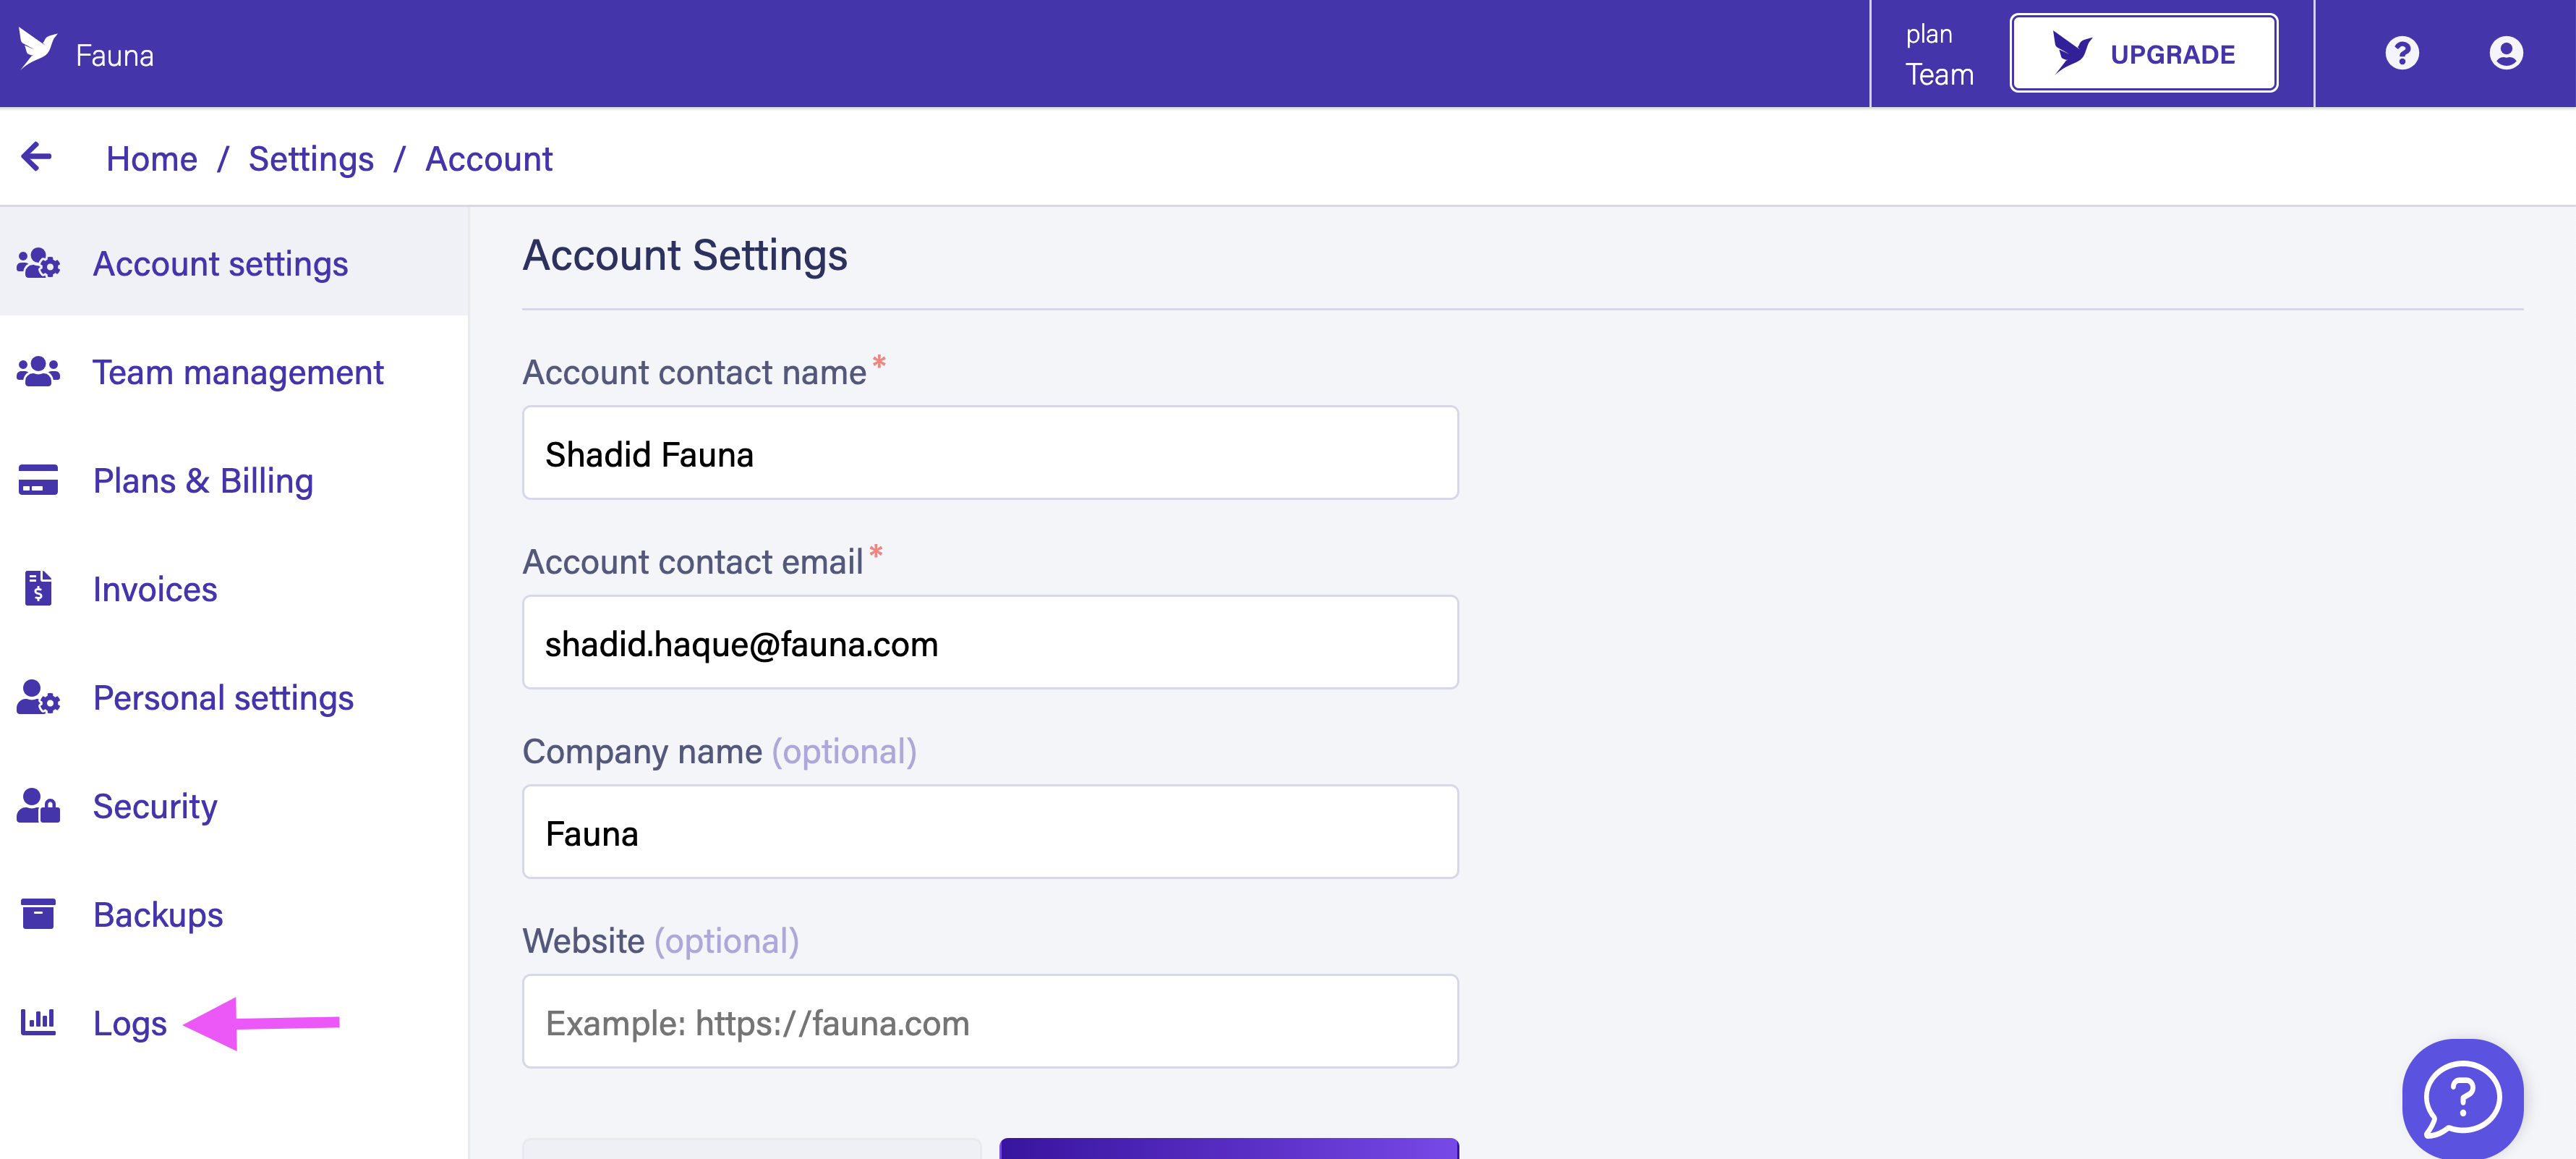
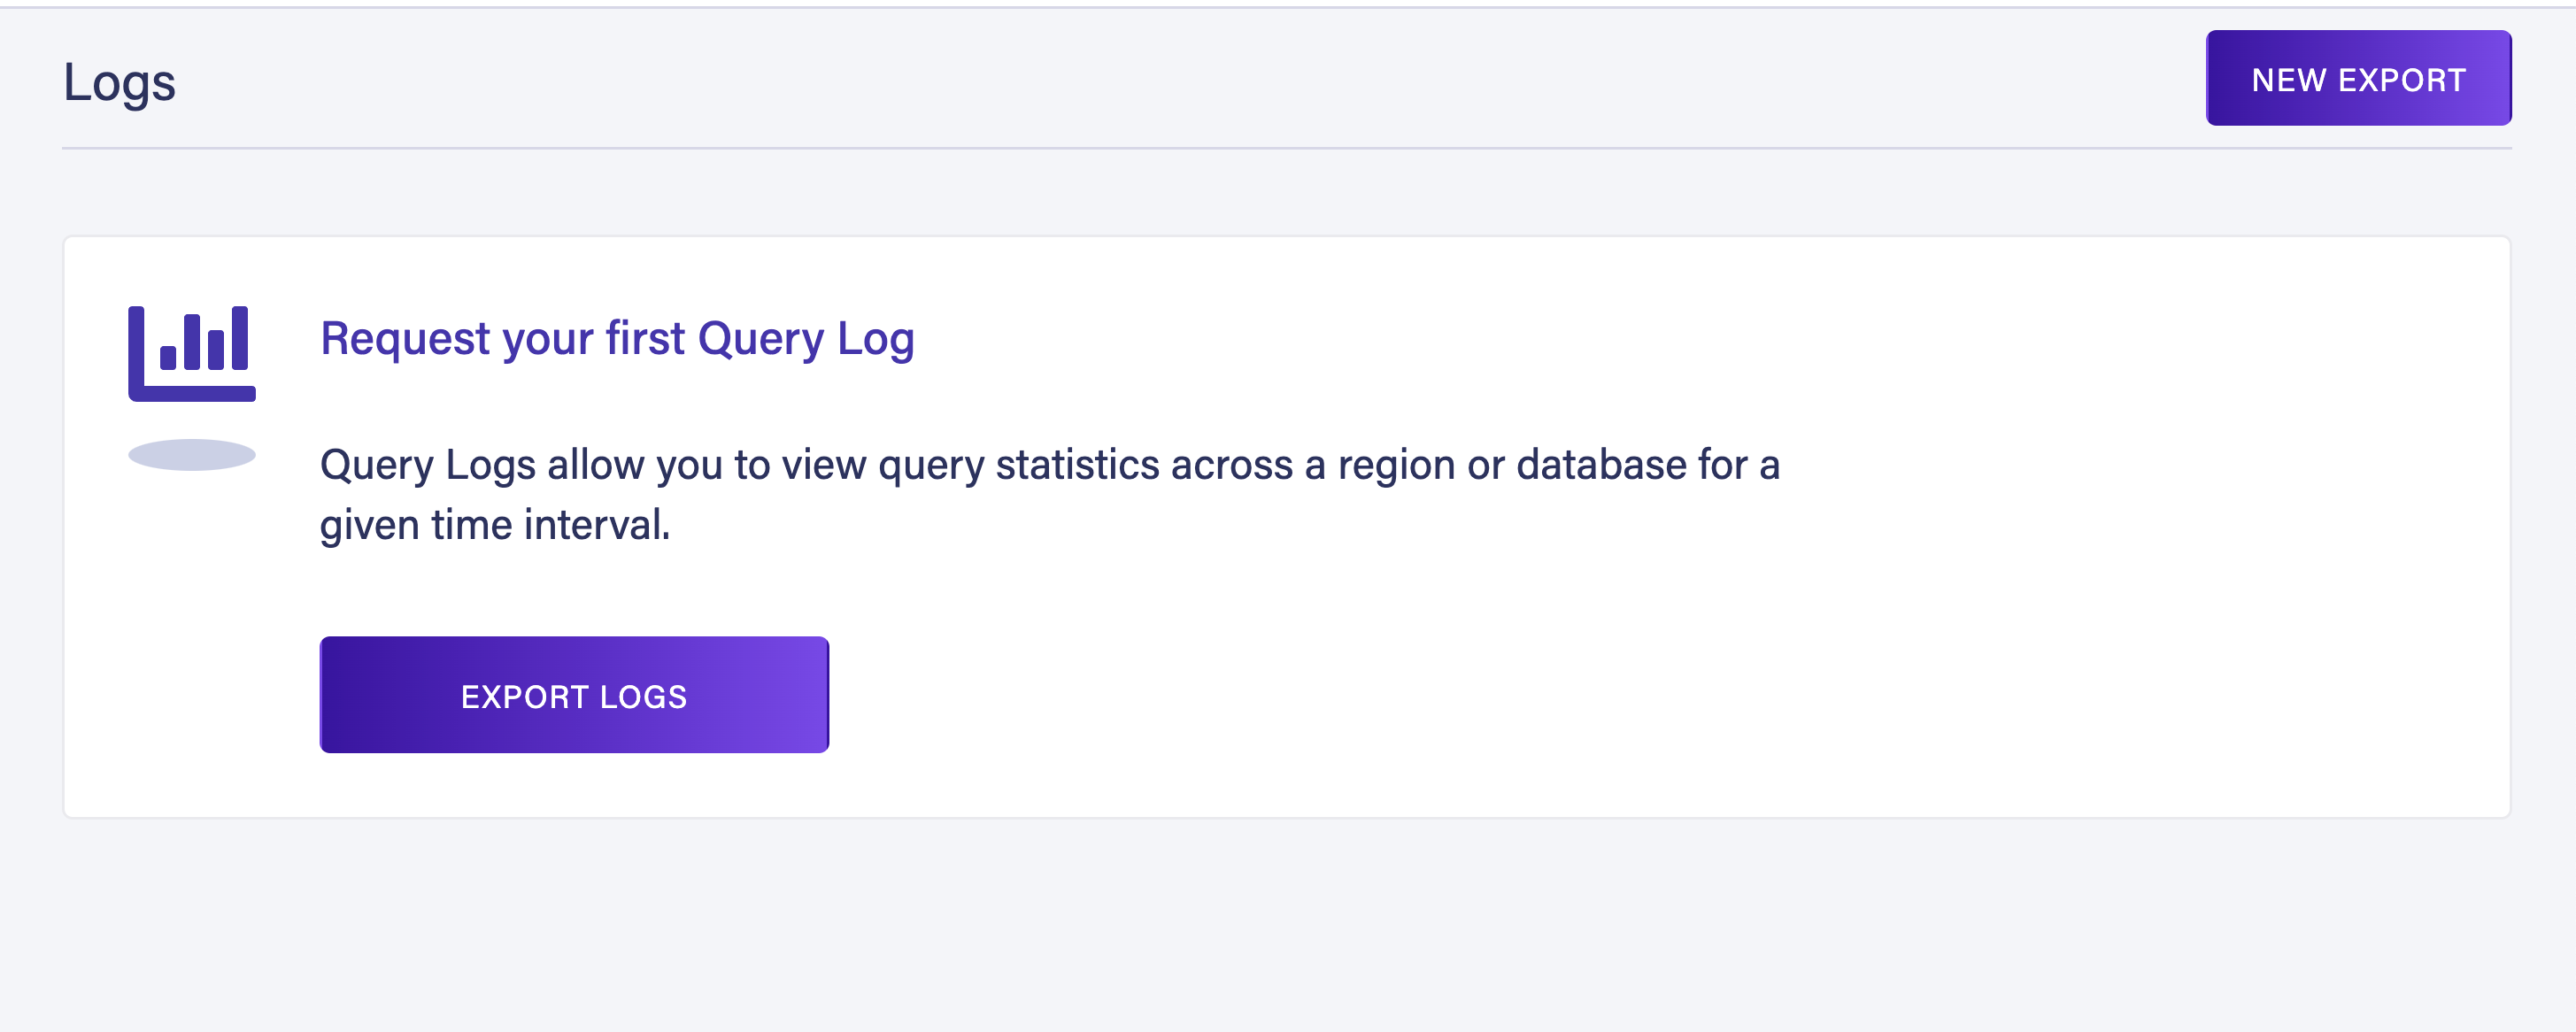
Select the Logs option. It takes you to a menu section where you can export query logs from Fauna. From the menu select New Export or Export Logs
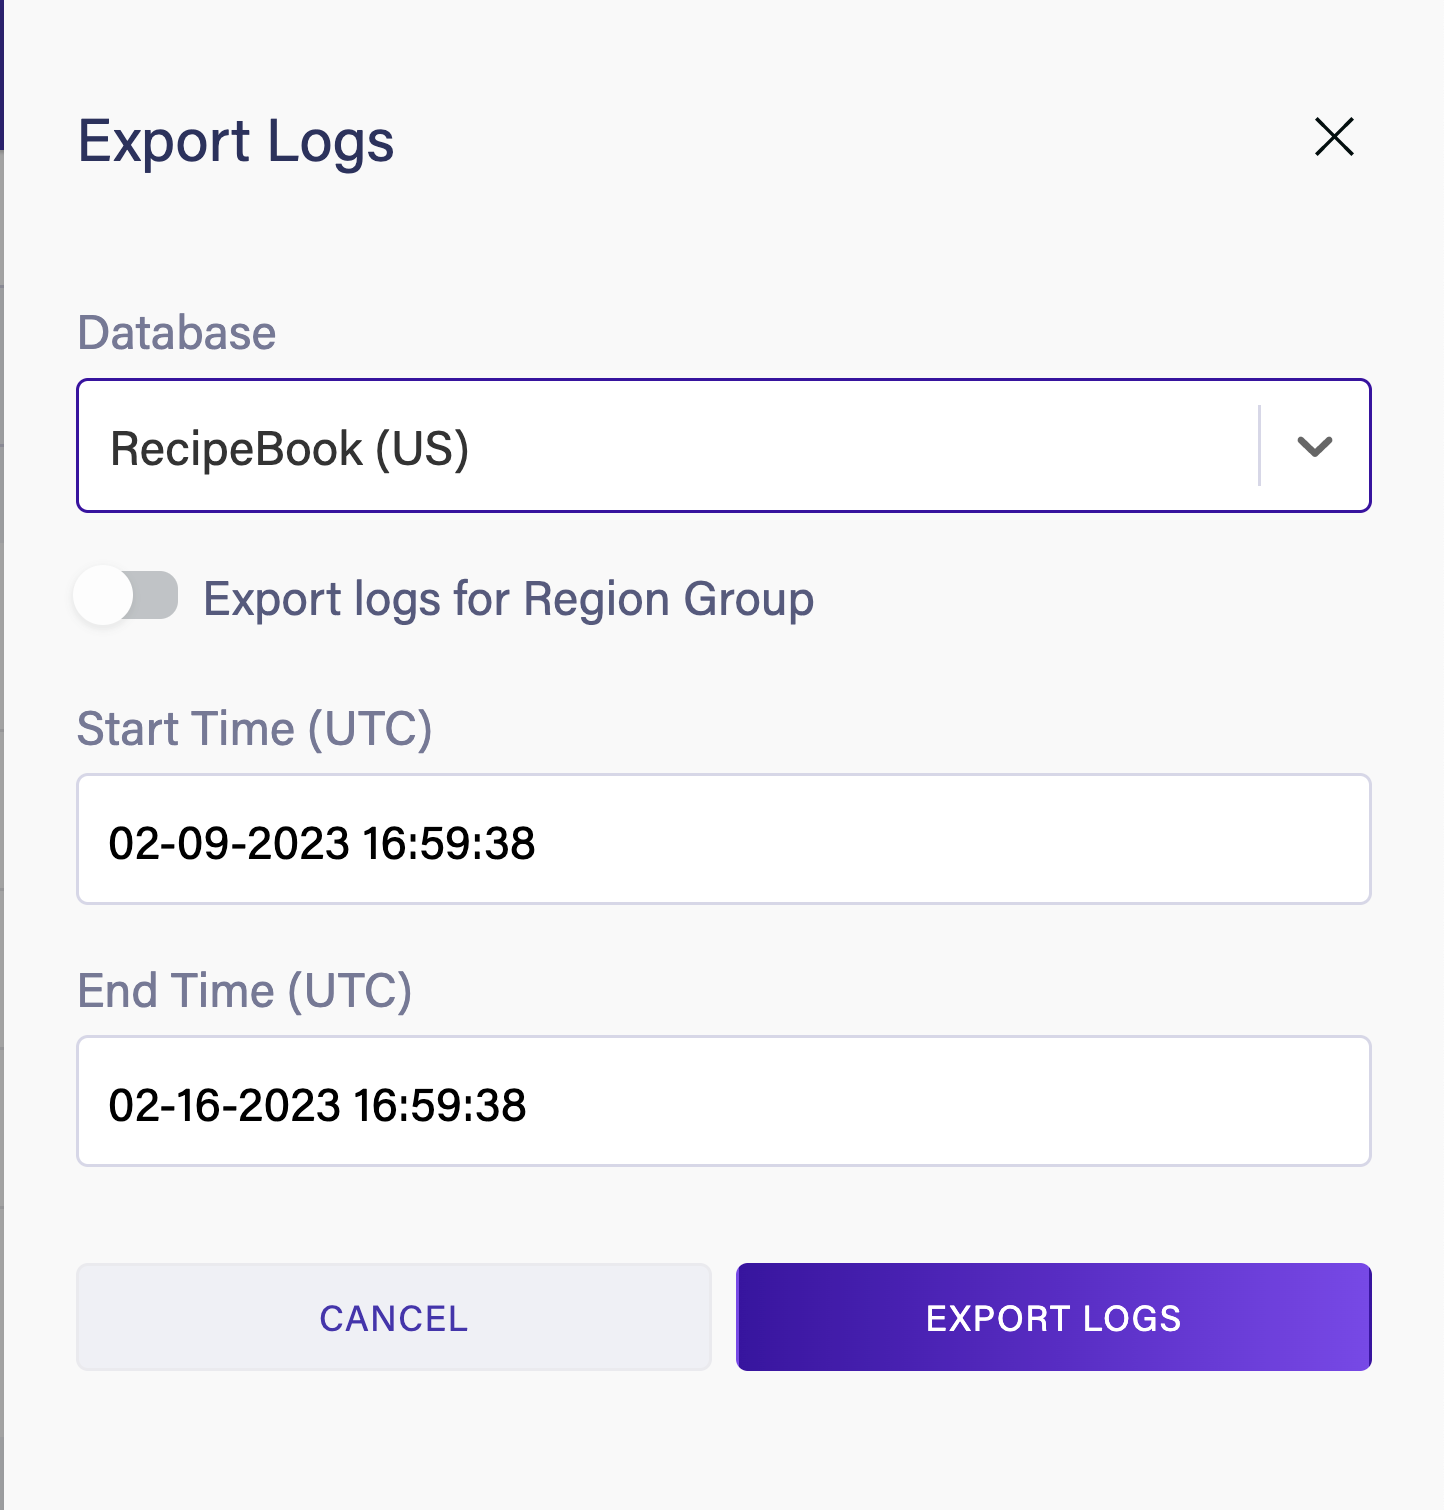
In the Query Log menu, select a database. Then select a date range for which you want to export the logs for. Next, select Export Logs.
Fauna will generate a log bundle for your database. Select Download Bundle to download your query logs.
Fauna downloads the bundle as a zip file. When you unzip, it gives you a jsonl file. This file contains all your database log information. Each line of this file is a valid JSON object. Below you can see a sample object.
{
   "BYTES_IN":462,
   "BYTES_OUT":315,
   "BYTE_READ_OPS":0,
   "BYTE_WRITE_OPS":1,
   "COMPUTE_OPS":1,
   "DATABASE":[
      "RecipeBook"
   ],
   "QUERY_TIME_MS":18,
   "REGION_GROUP":"us-std",
   "REQUEST_HEADERS":"{\"user_agent\":\"Mozilla/5.0 (Windows NT 10.0; Win64; x64) AppleWebKit/537.36 (KHTML, like Gecko) Chrome/109.0.0.0 Safari/537.36\",\"x_forwarded_for\":\"99.224.95.239\"}",
   "REQUEST_METHOD":"POST",
   "RESPONSE_CODE":"200",
   "TAGS":{

   },
   "TRACEPARENT":"00-ba59ea899a24ca07cf0a7dd42db74b8d-ea06d8dc8b8e7888-00",
   "TS":"2023-02-09 02:36:02.290 Z",
   "TXN_RETRIES":0
}
Each entry contains the following fields.
Similarly, you can export all the query logs for an entire region group. Select Export logs for the Region Group option and select a region while exporting query logs.

Access Fauna Logs through the command line
For those who prefer the command line, you can pull query logs directly from your terminal. We created a sample command line application to download query logs. You can explore the code for it here.
Clone the repository with the following command.
$ git clone https://github.com/fauna-labs/fauna-query-logs-cli-app
$ cd fauna-query-logs-cli-app
Run the following command to start the CLI application.
$ npm install
$ npm run demo
The CLI tool prompts you to enter your email and password for authentication. After login, you can select a database or a region group to pull query logs from.
> querylogs-demo@1.0.0 demo
> node index.js

✔ Enter the email address for your account … <Your-email>
? Enter the password for your account › <Your-Password>
You select a database/region group, and data range, and the CLI tool downloads the query logs for you.
Once downloaded, you can explore the logs in your favourite tools or in the terminal. For instance, I am analyzing them in Emacs in the terminal.
{"id":"9e07170b09ab97d571aa","session_id":"9e07170b09ab97d571aa","secret":"fnAEq9QRQCACIdqTkaK0qDlj2Q6m21z8blUgqCQg","user":{"name":"","email":"your@email","id":"291900343499883012","otp_enabled":null,"role":"owner","created_at":"2021-03-01T22:11:50Z"},"account":{"company_name":"company_name","account_id":"291900343499883012","legacy_account":false},"regionGroups":{"global":{"regionPrefix":"global","regionName":"Global","secret":"fnAEwQgRQCACQdETqaK0qDlj296m2Qz8blqgqCQg","url":"https://db.prev.faunadb.net:443","graphqlUrl":"https://graphql.fauna-preview.com"},"eu":{"regionPrefix":"eu","regionName":"Europe","secret":"fnAEq9gRRPAqYKyzP_2JQnuerEIkquoB59qRFAq0","url":"https://db.prev.faunadb.net:443","graphqlUrl":"https://graphql.fauna-preview.com"},"us":{"regionPrefix":"us","regionName":"United_States","secret":"fnAEwqgRPwAAIJXqjtR9yuGqqMEch7opUqWuqUlI","url":"https://db.prev.faunadb.net:443","graphqlUrl":"https://graphql.fauna-preview.com"}}}You can also directly export the data into more sophisticated third-party tools such as Logstash or Kibana for observability.
Tagging queries
Currently, you can use the JavaScript driver to
Tag queries. The following code snippet demonstrates adding certain tags to a query using the JavaScritpt driver.client.query(
q.Paginate(q.Collections("Product")),
{
tags: { key1: "value1", key2: "value2" },
}
)Summary
In brief, Fauna Logs give you insight into your database usage and queries. You can optimize your Fauna cost by analyzing query logs and writing efficient queries. In a subsequent tutorial, you will learn how to use query logs with your favorite log metric tools such as Elastic and Datadog. Head over to our documentation to learn more about Fauna Logs.
The Fauna service will be ending on May 30, 2025. For more information, read the announcement and the FAQ.
Subscribe to Fauna's newsletter
Get latest blog posts, development tips & tricks, and latest learning material delivered right to your inbox.