
How to get database insights with Fauna Logs and the Elastic (ELK) Stack
Database query logs provide valuable insights about your application and can provide information about how users interact within the application, what they look for, and how they use application features. Fauna's query logs allow you to download and analyze your database logs. This article demonstrates how to use the Elastic (ELK) Stack — Elasticsearch, Logstash, and Kibana — as an observability tool for Fauna Logs.
Pre-requisites
- Docker installed on your machine
- docker-compose installed
- Basic familiarity with Fauna
- Basic familiarity with Elasticsearch, Logstash, and Kibana
Setting up the Elastic (ELK) Stack
Elasticsearch, Logstash, and Kibana are open source tools. You can run them on your local machine for development purposes. This tutorial will use Docker to get an Elastic Stack cluster up locally. However, you can also get a dedicated cloud deployment of the Elastic Stack from cloud.elastic.co, or host it in your favorite cloud provider.
Elastic Stack on Docker
Clone the following repository in your local machine.
$ git clone https://github.com/fauna-labs/fauna-logs-with-elasticChange directory to the repository.
$ cd fauna-logs-with-elasticMake sure Docker is running in your machine. Run the following command to start up the ELK server.
$ docker compose up -d Once the Docker images are up and running visit localhost:5601. Your default username is
elastic and password is changeme. Change your username and password to something more secure after first run.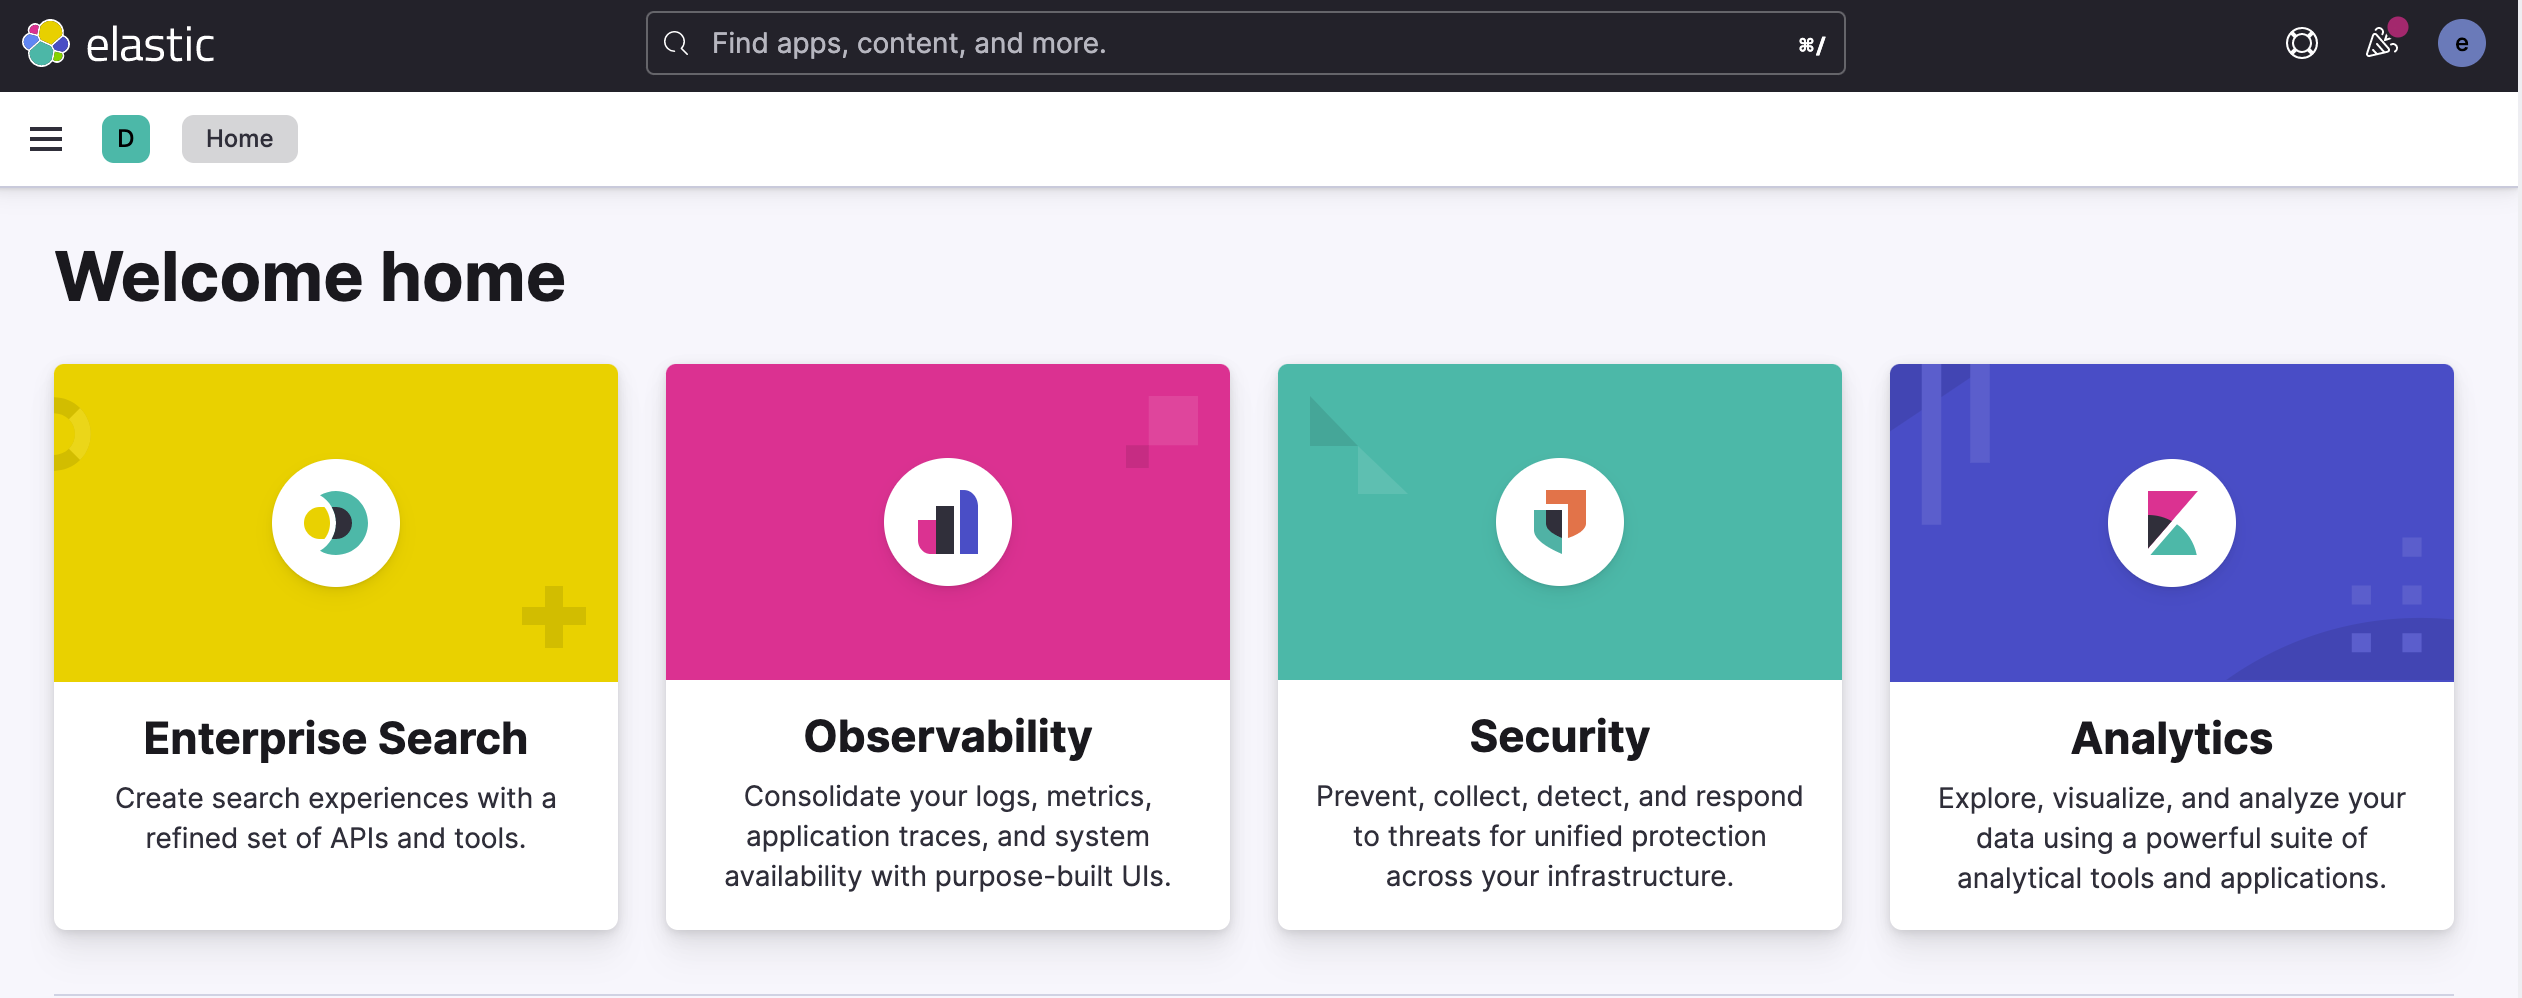
At this point, you are ready to import the Fauna logs into Elastic.
Accessing Fauna Logs
Access logs through the Fauna dashboard
The easiest way to access Fauna logs is through the Fauna dashboard. Be advised you have to have a Team or Business plan to access Fauna query logs. From the dashboard menu select user profile icon and then select setting.
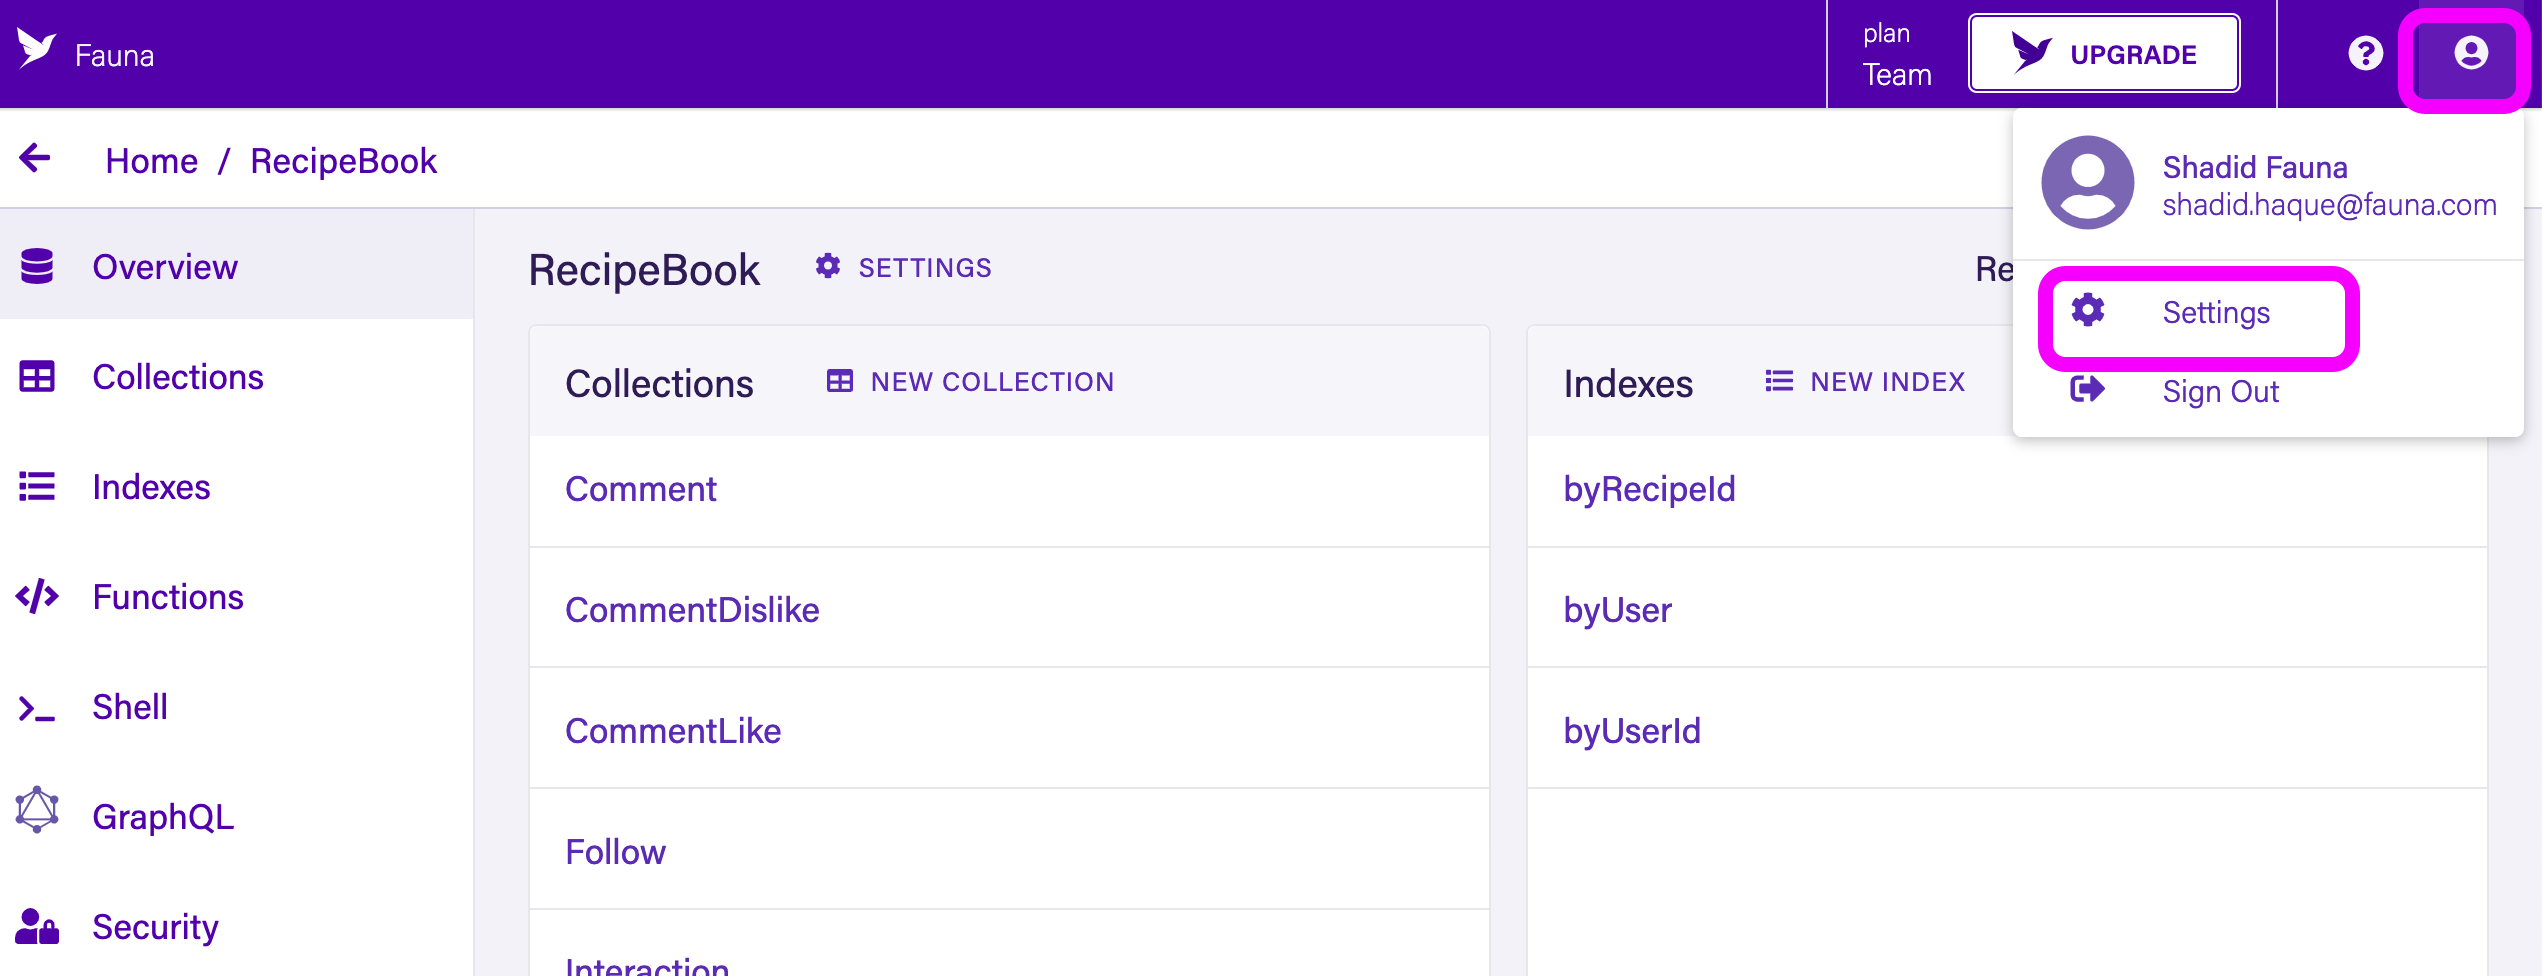
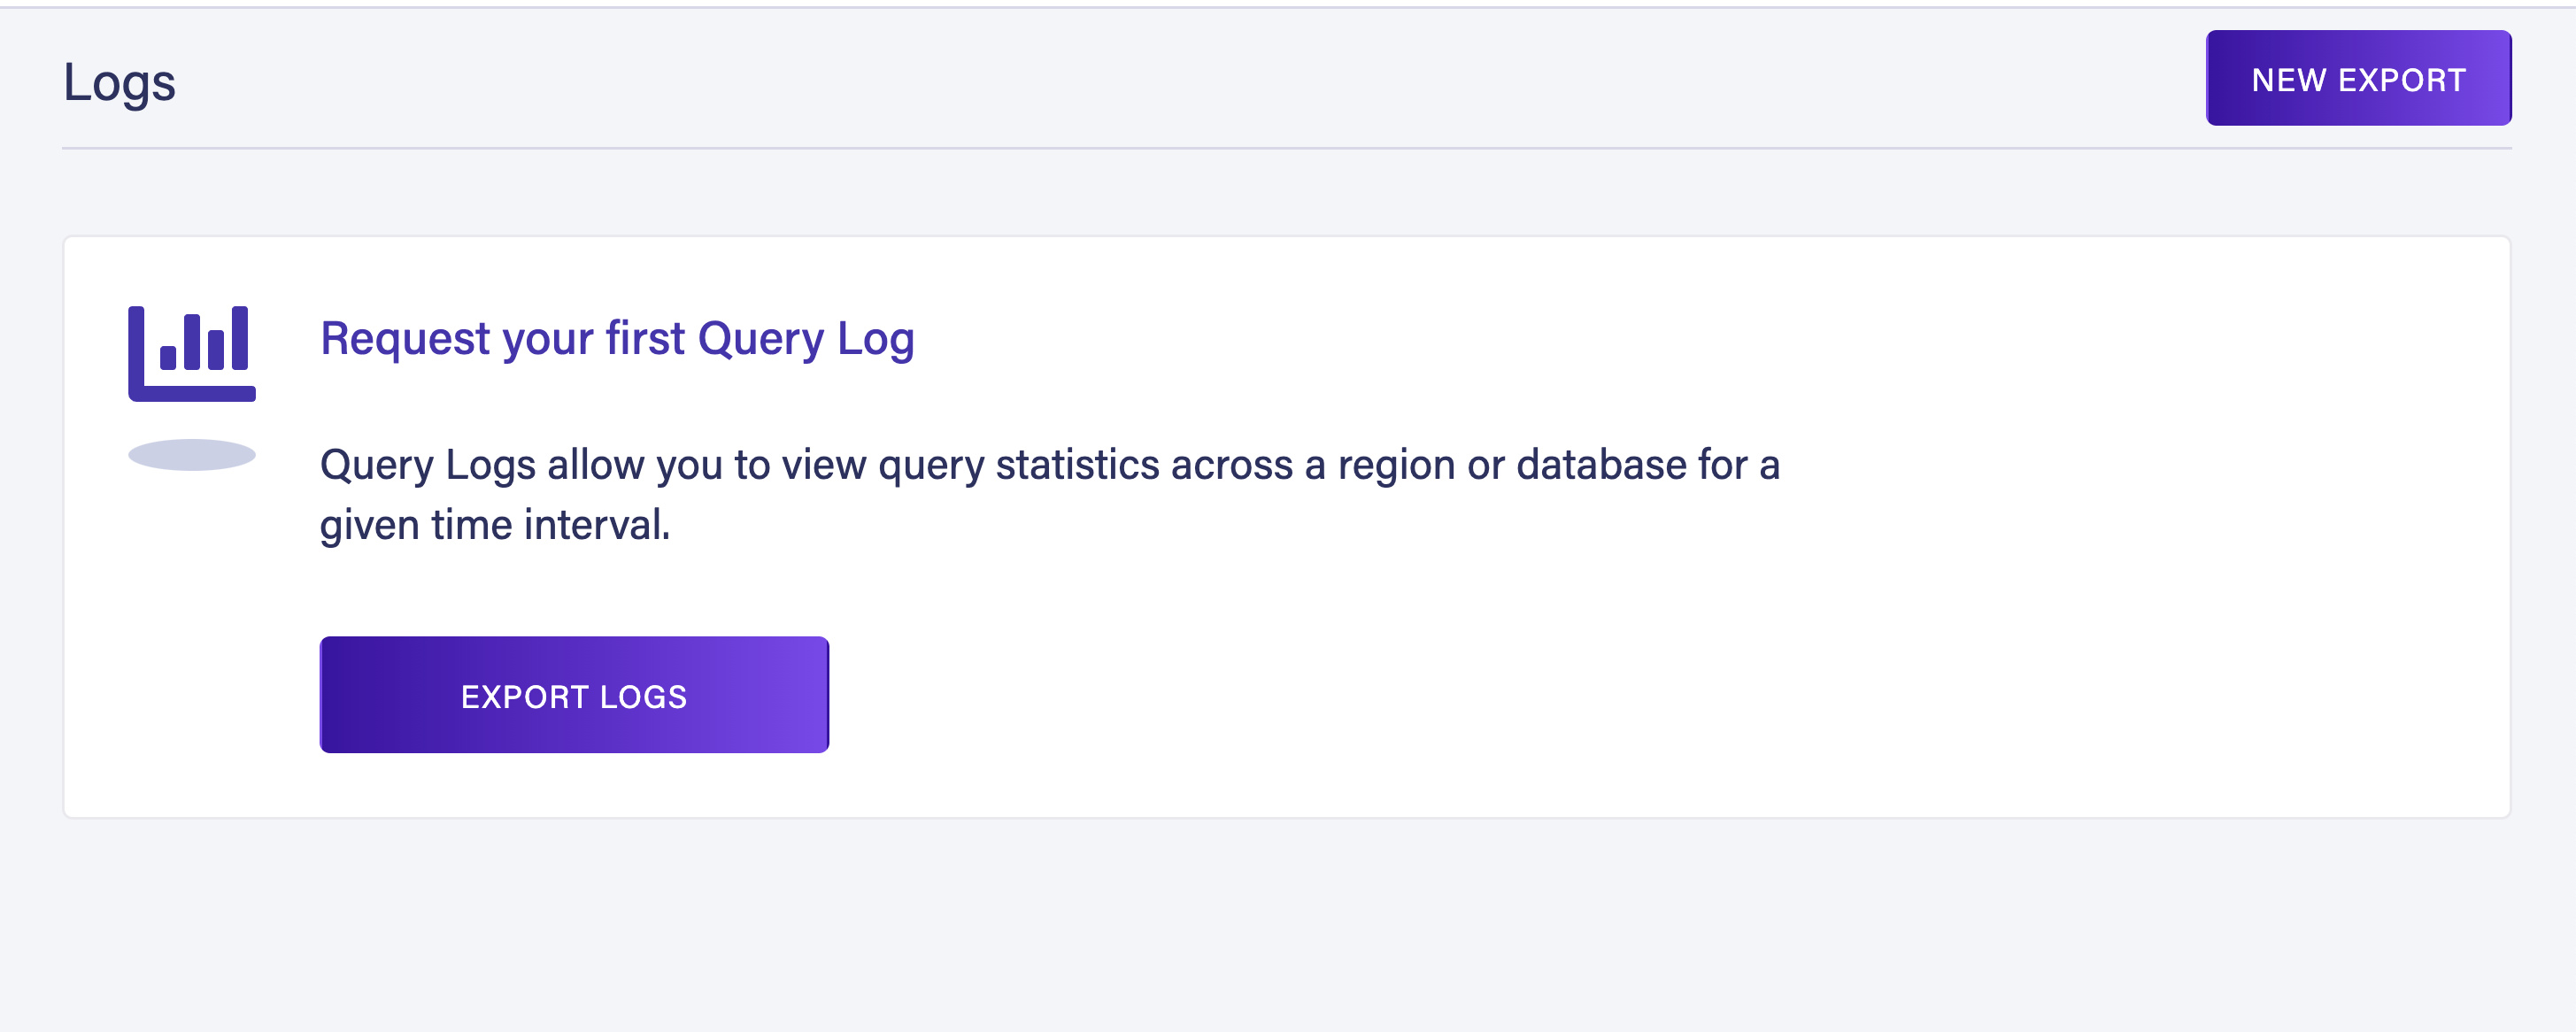
Next, select Logs option from the side menu.
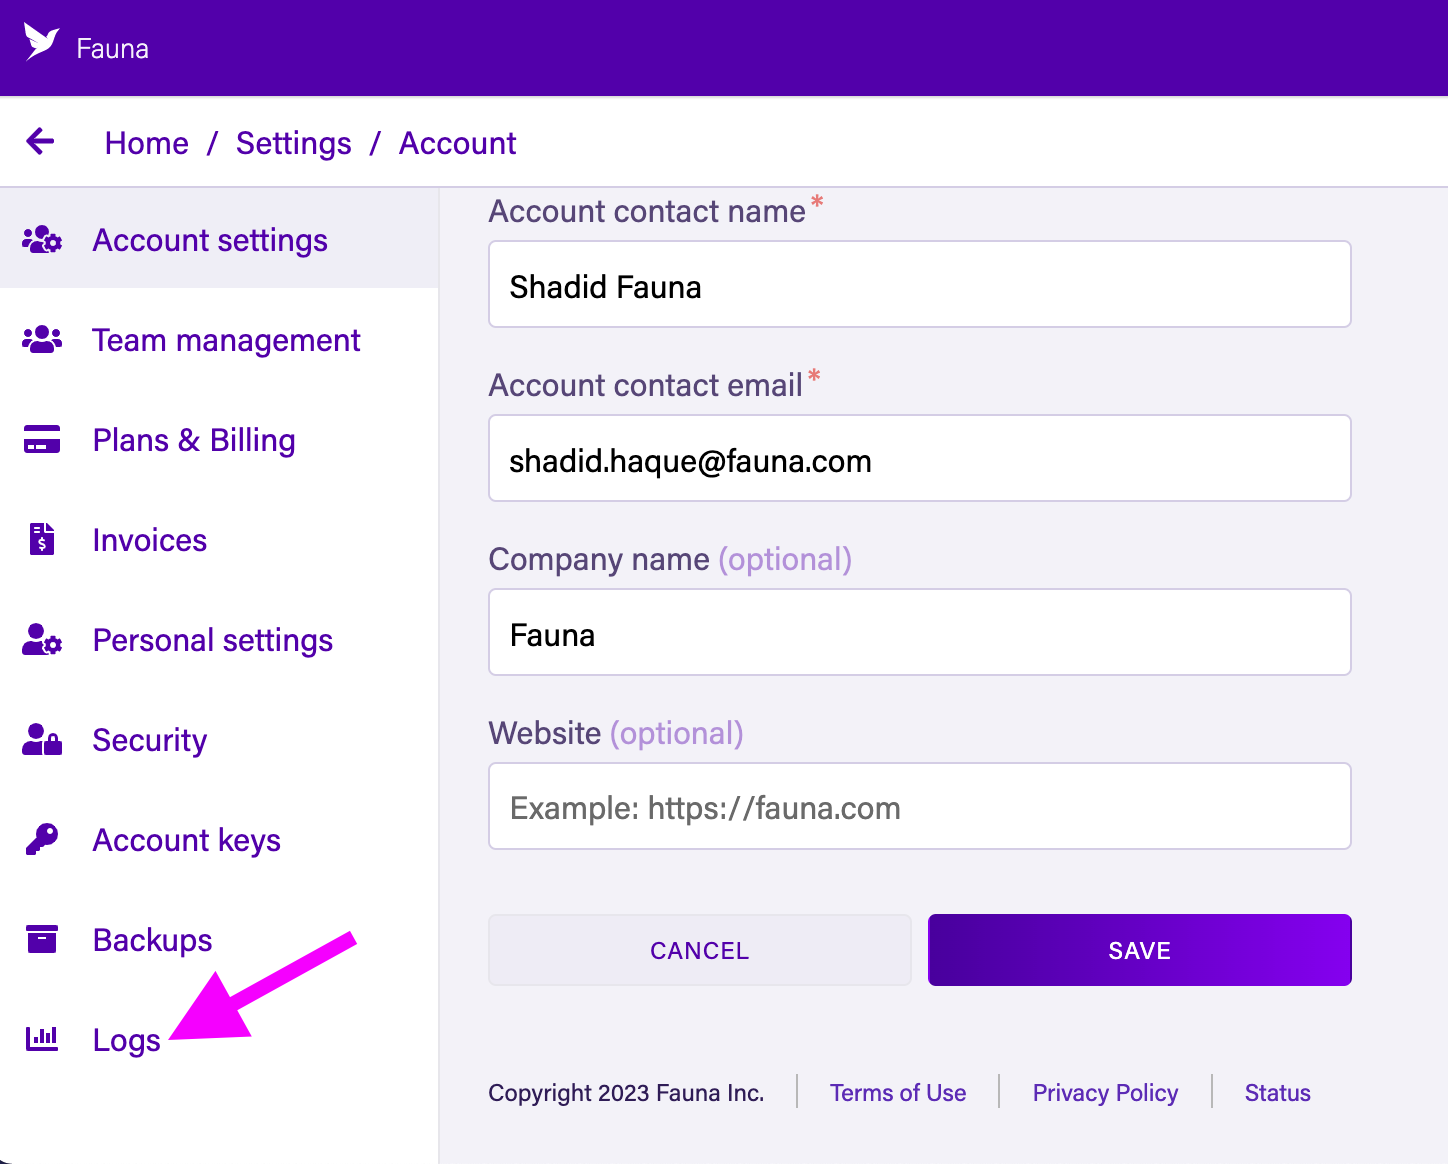
It takes you to a menu section where you can export query logs from Fauna. From the menu select New Export or Export Logs.
In the Fauna Logs menu, select a database. Then select a date range for which you want to export the logs for. Next, select Export Logs.
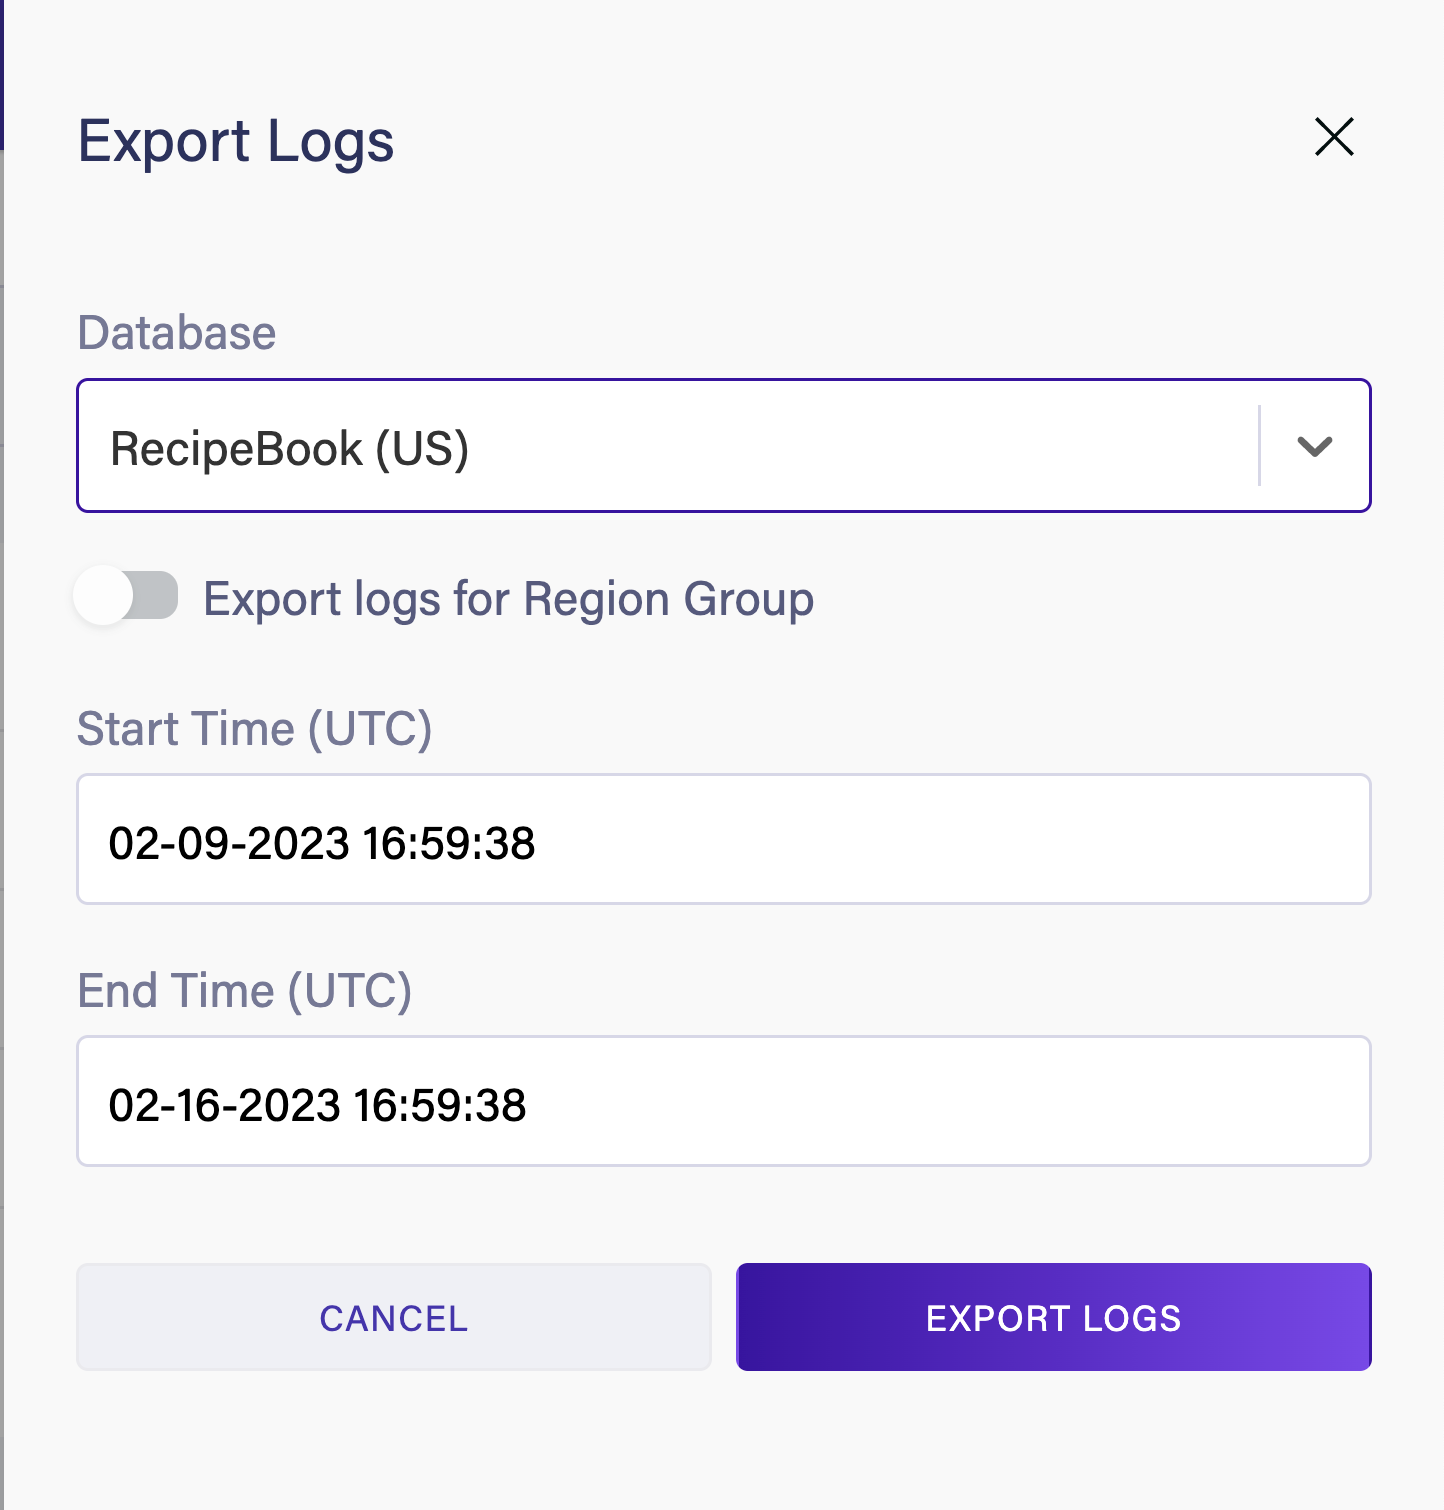
Fauna will generate a log bundle for your database. Select Download to download your query logs.
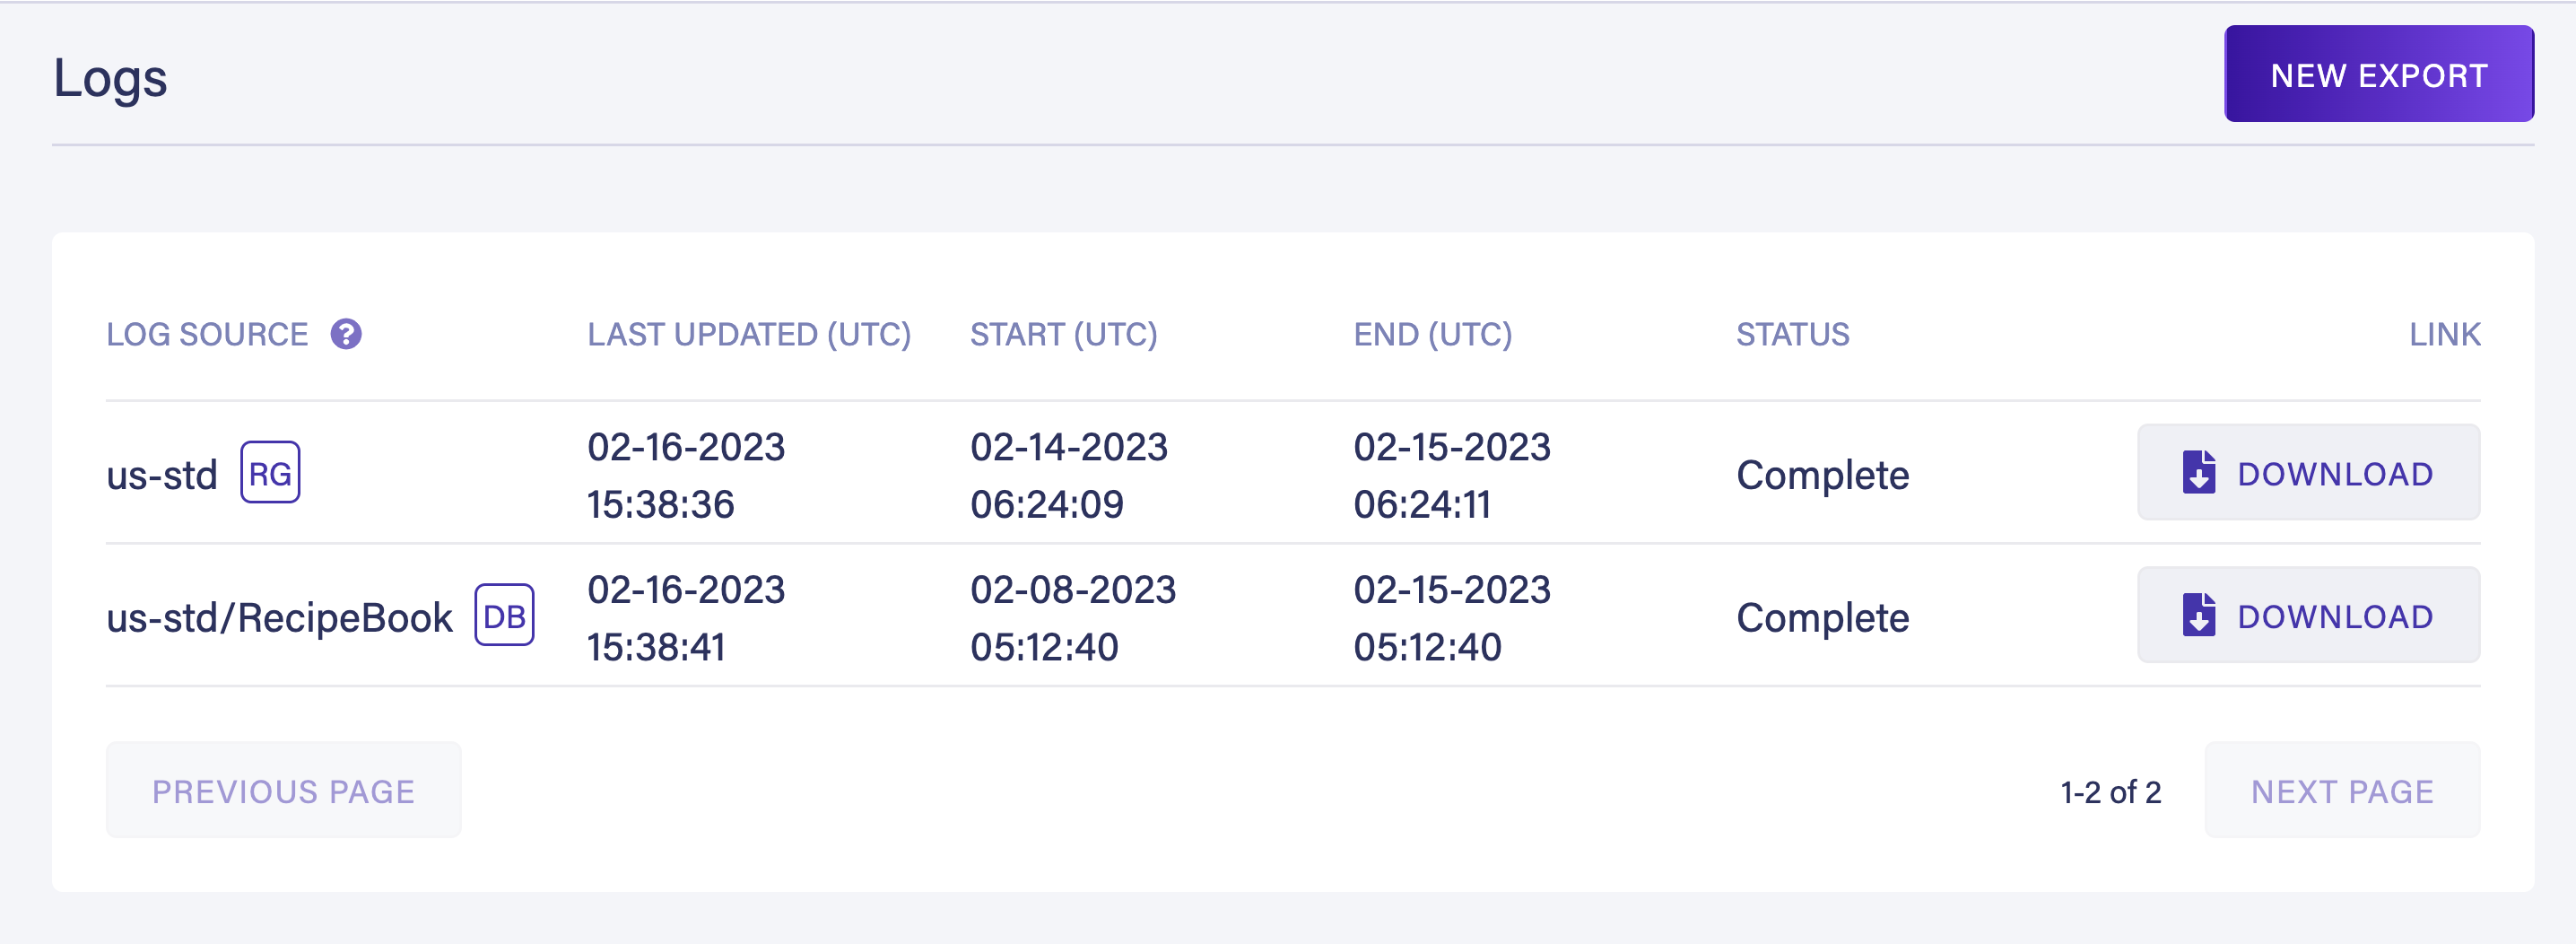
Fauna downloads the logs as a zip file. When you unzip, it gives you a
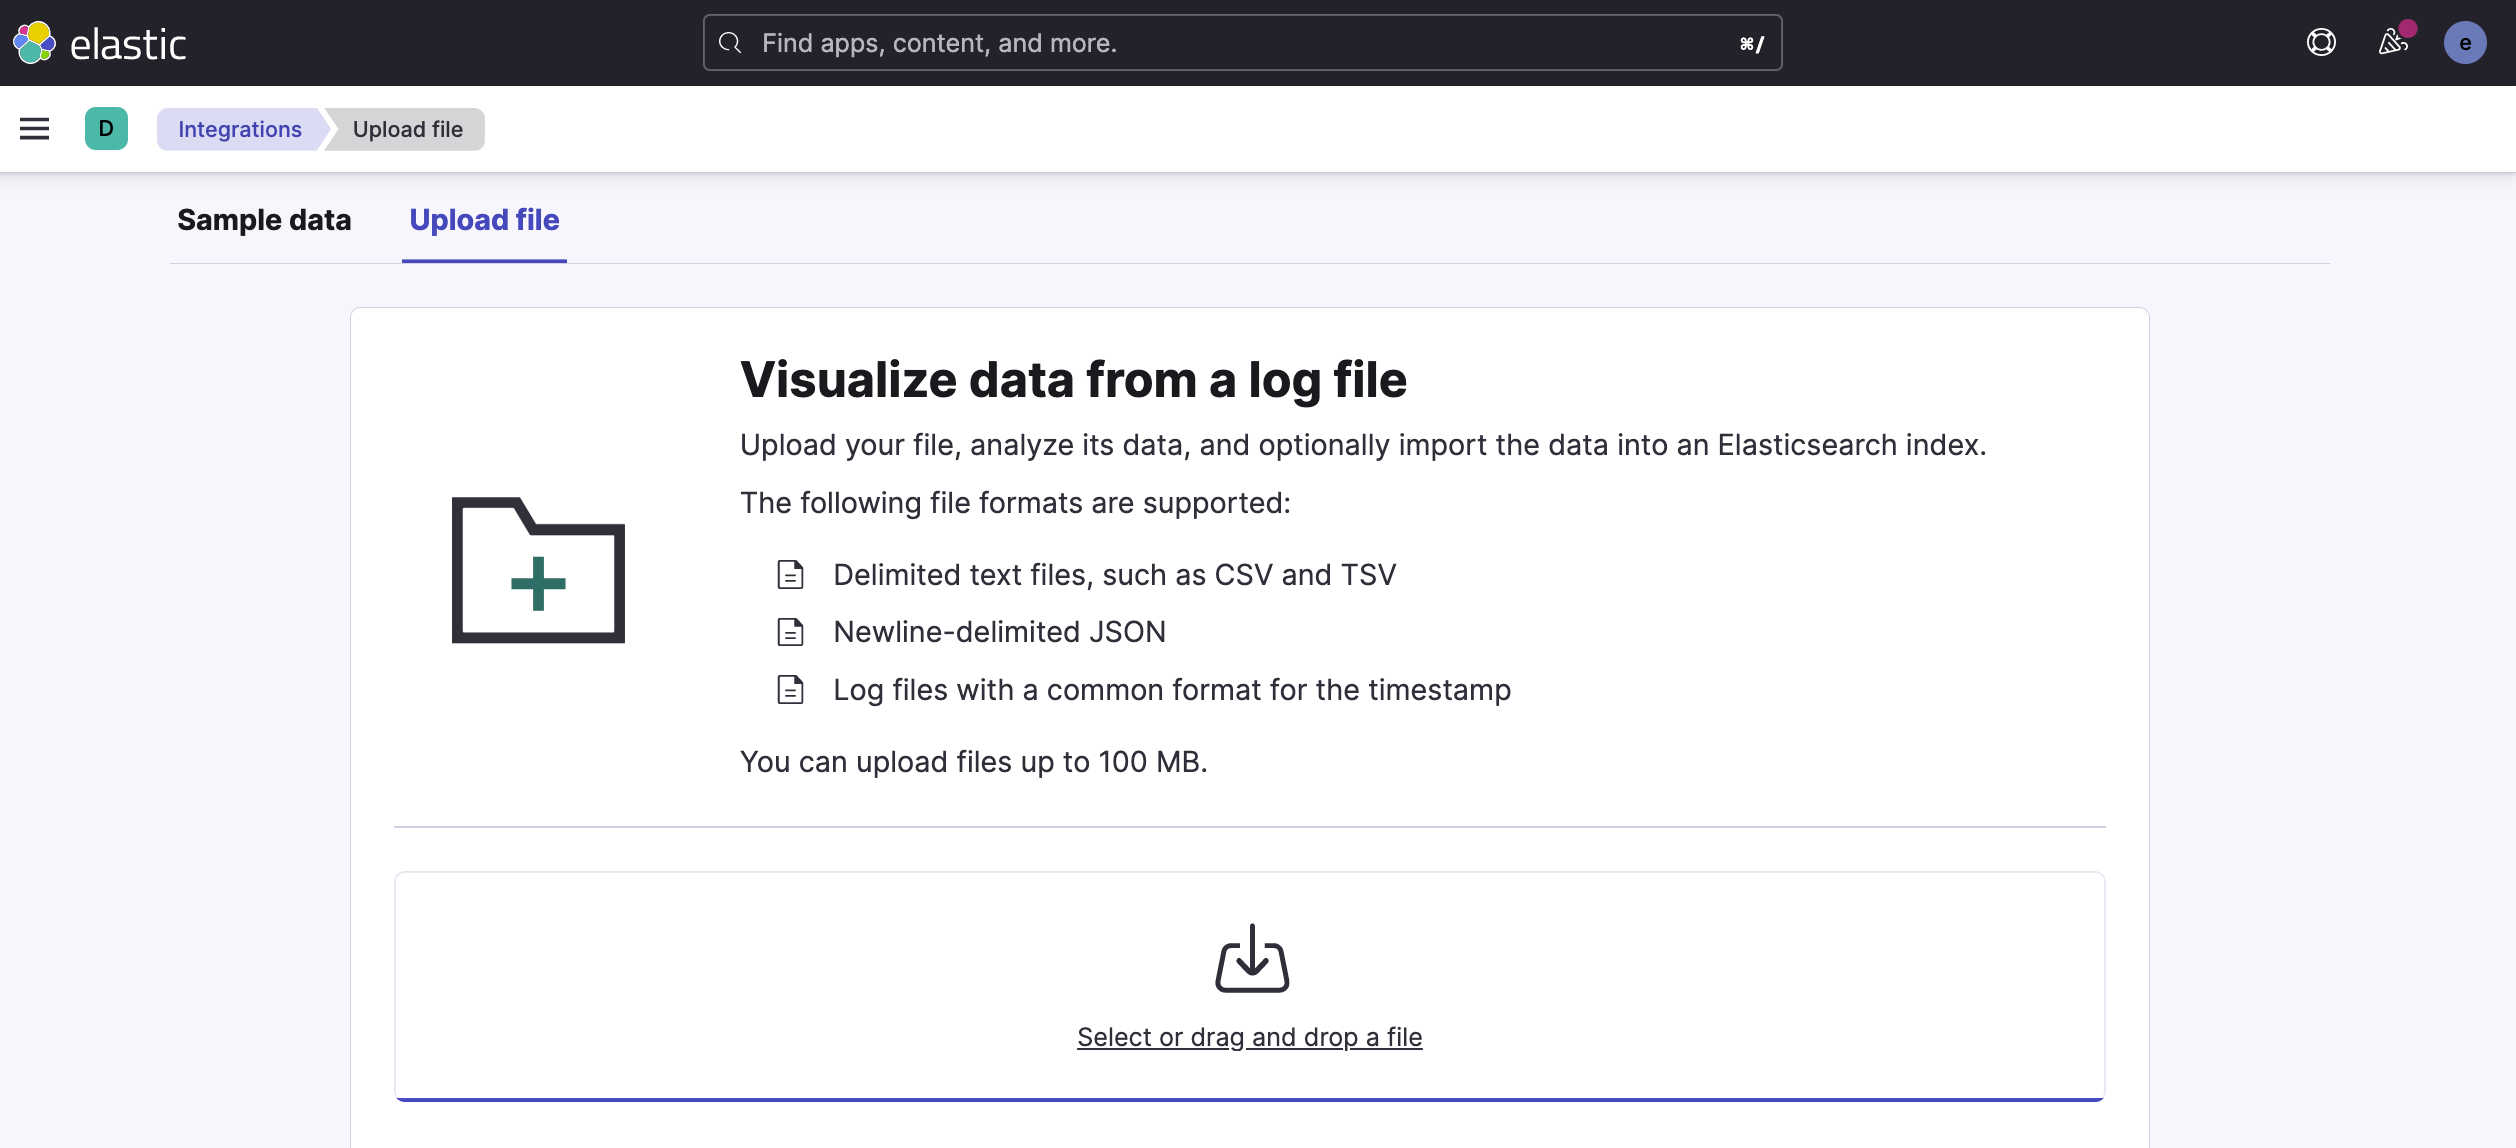
jsonl file. This file can be directly imported into Logstash for analysis.Head back to the Elastic (Kibana) dashboard and select Upload a file from the getting started menu. Upload the
jsonl file that you downloaded from Fauna.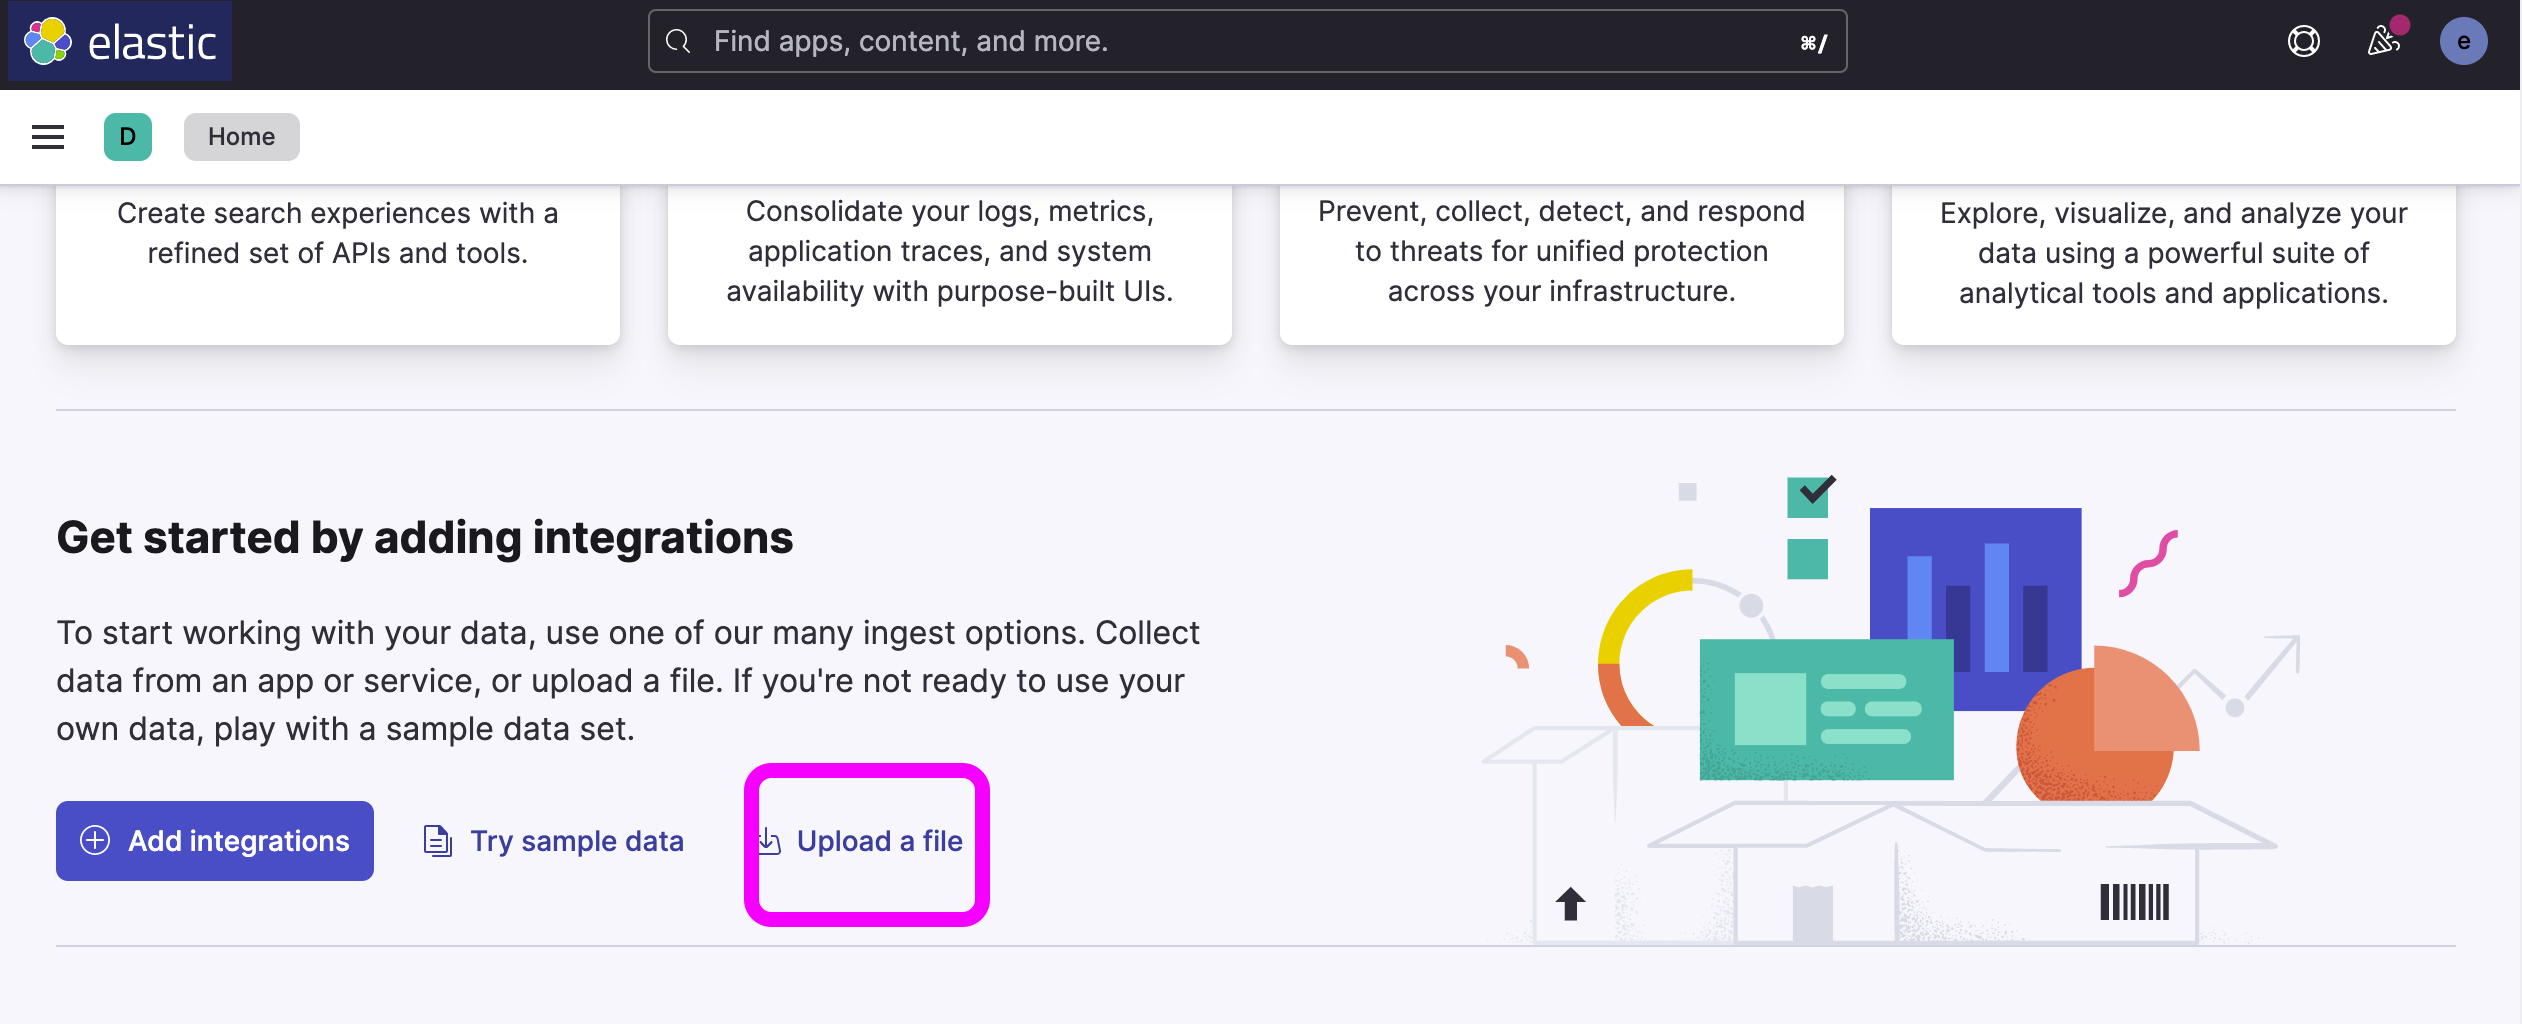
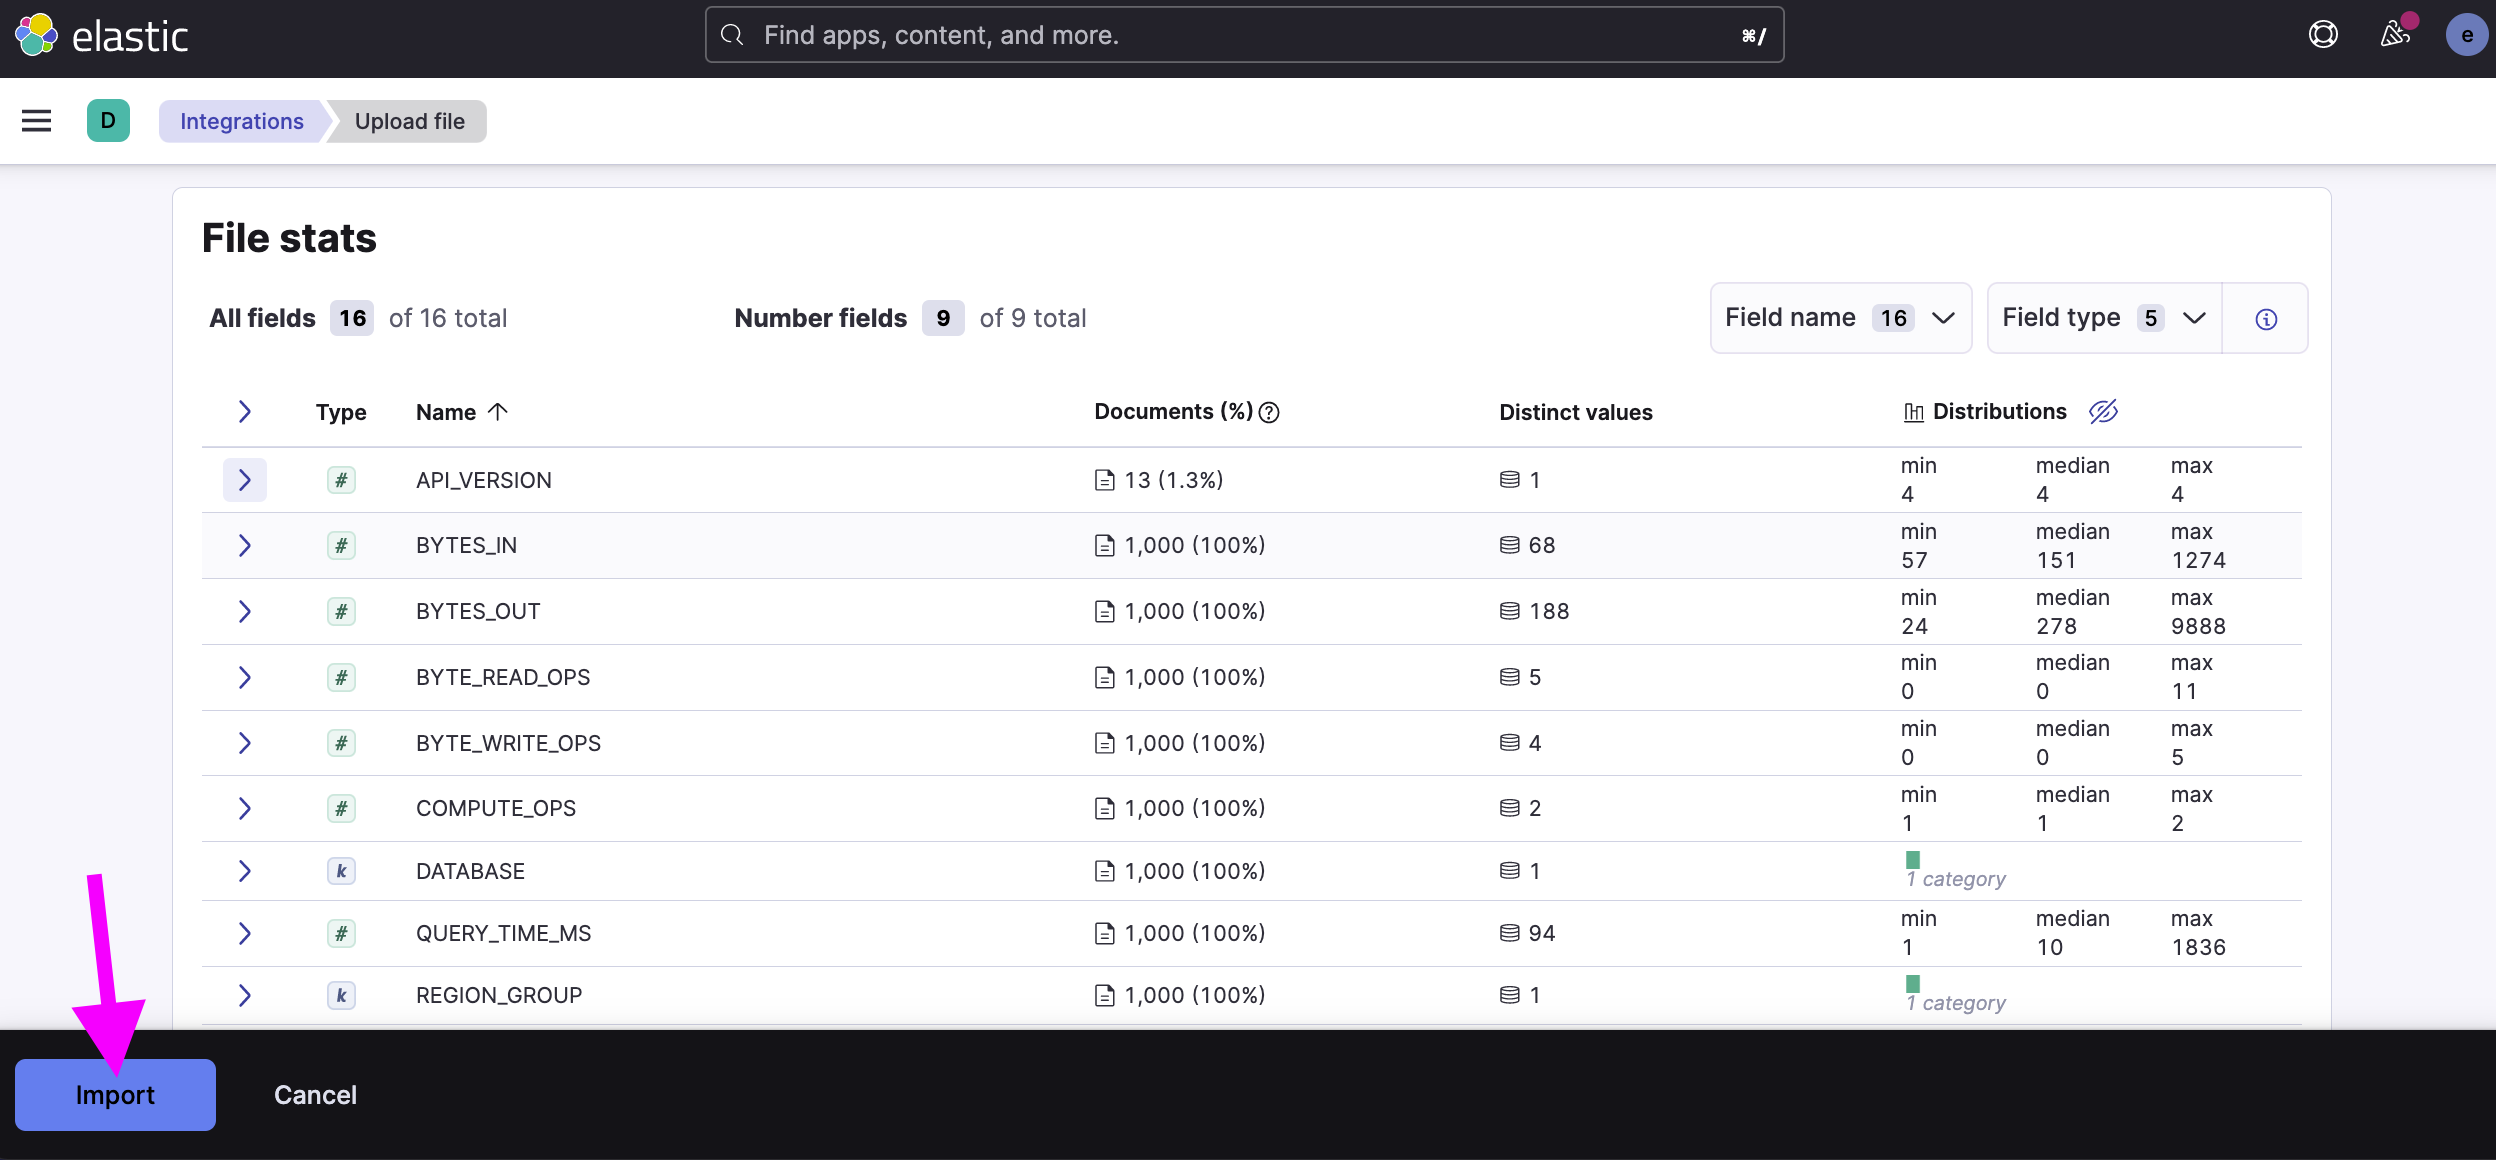
Logstash will automatically add different fields from your log files to the dashboard for visualization. Review the file stats and select import.
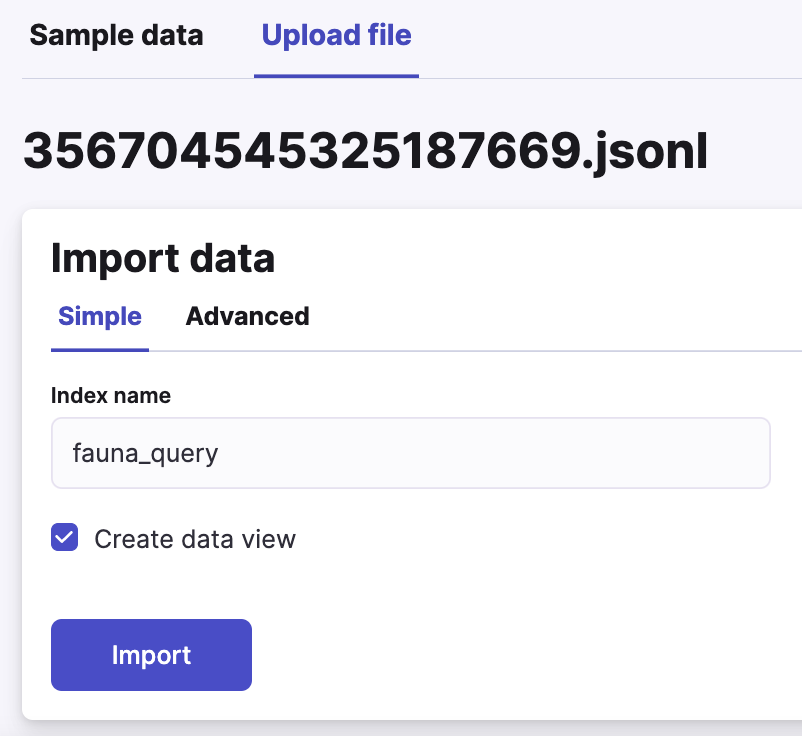
Give your data an index name and select import. We are calling it fauna_query in this example.
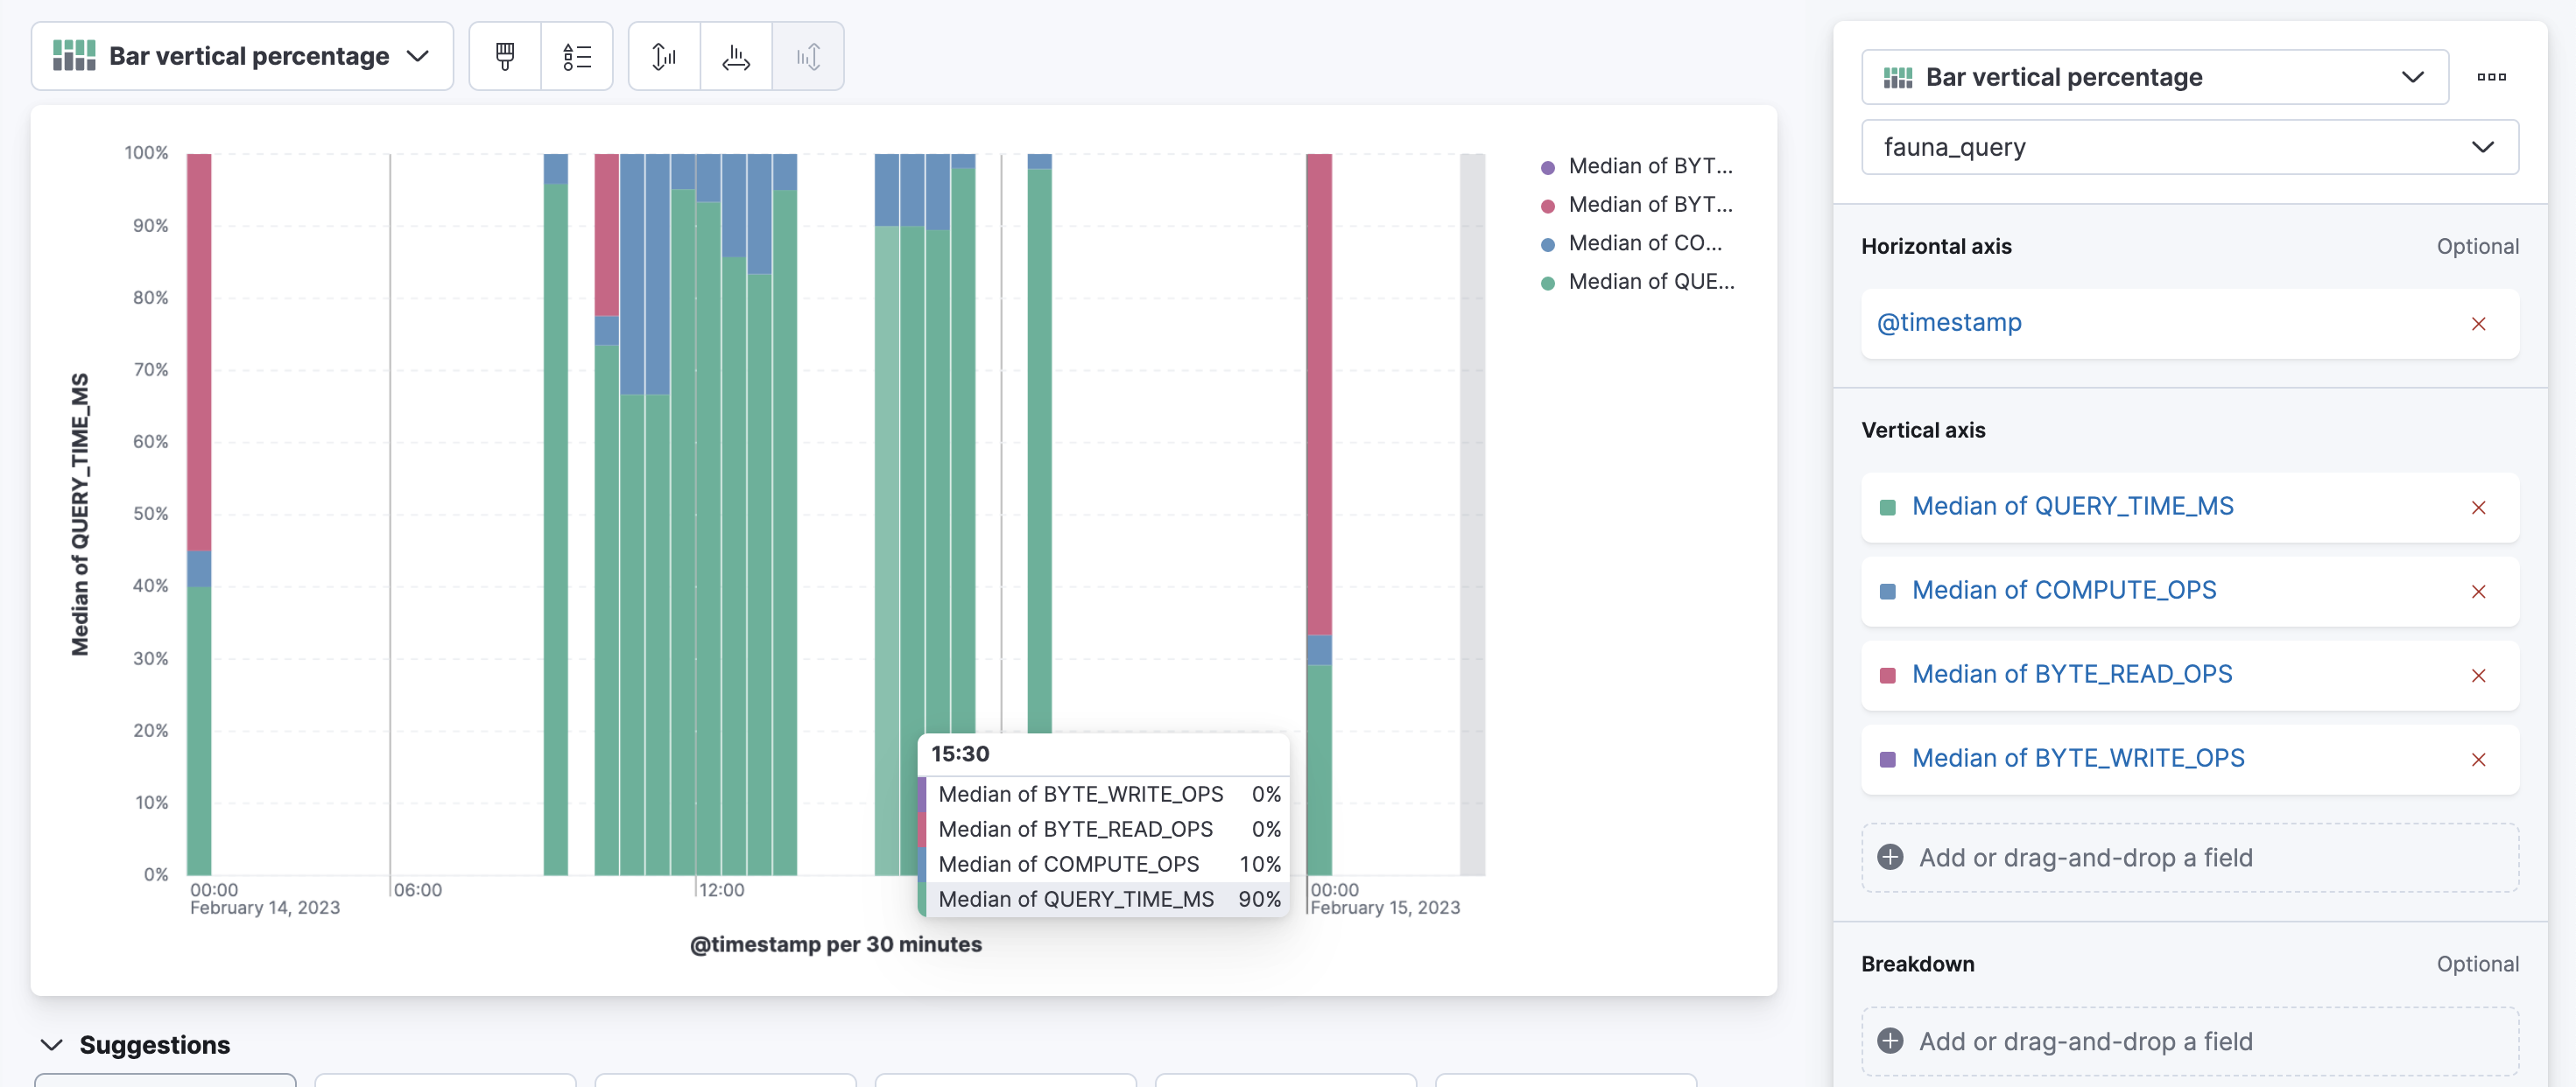
Using the drag-and-drop interface in Kibana, you can create a visualization for the logs. In the following picture, we created a simple bar chart to visualize the query time vs compute operation usage for each query over a time period.
Visit elastic.co to learn more about log analytics and visualization.
Access logs programatically
You can also request query logs programmatically from Fauna and upload them directly to ELK. To get query logs through a script, you need an account key.
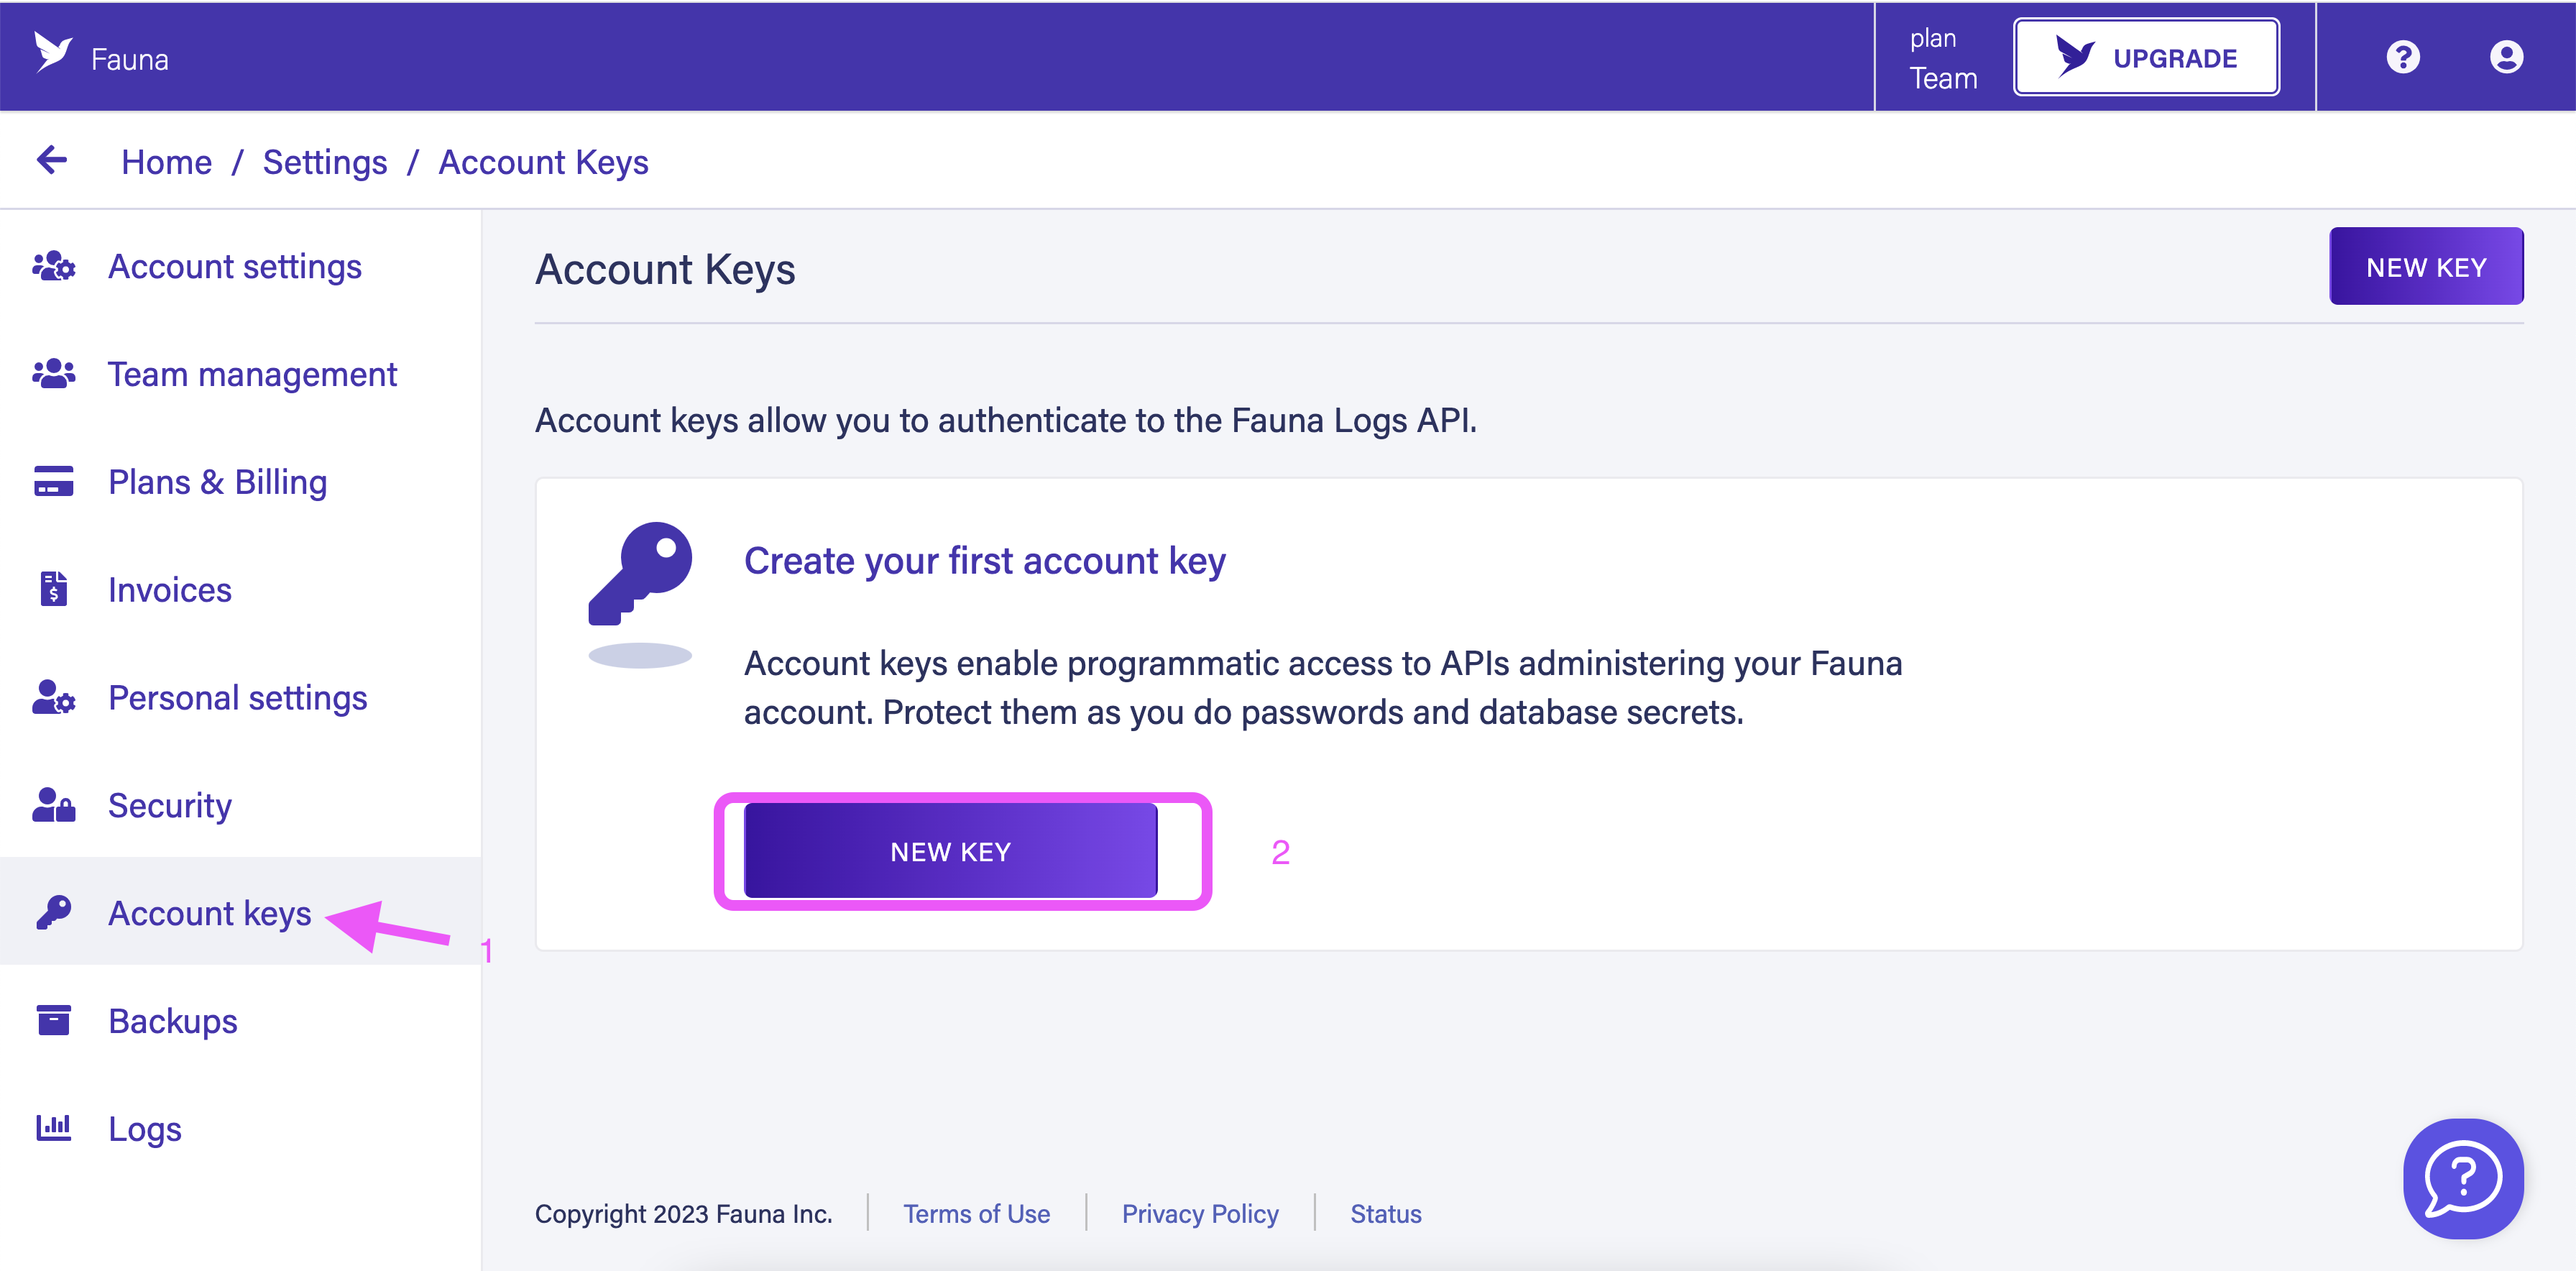
Head over to Fauna dashboard. From the account settings menu, select Account Key. Then select New Key to generate an account key.
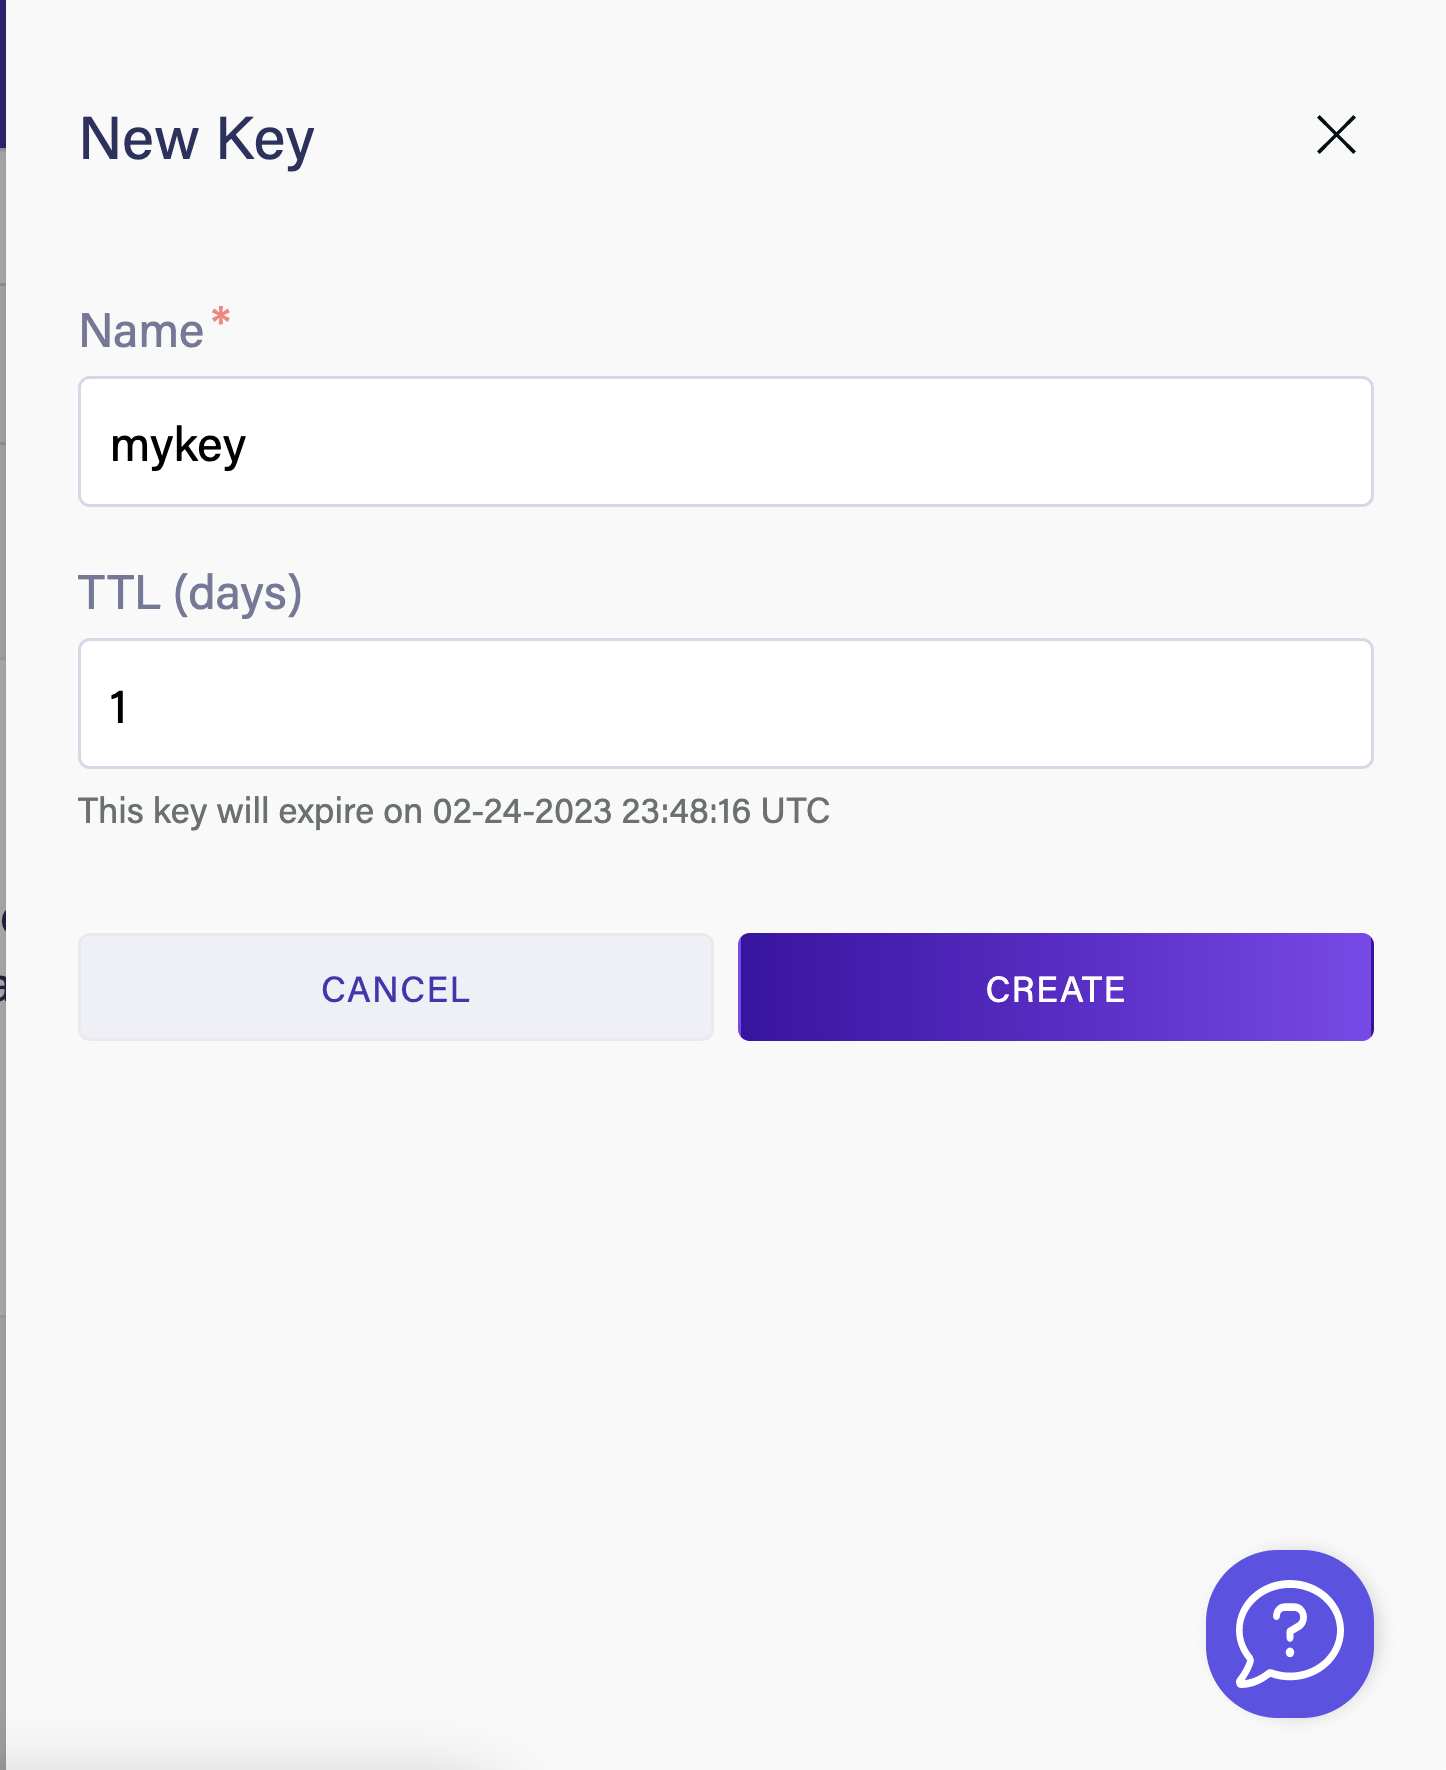
Give your key a name. Specify a TTL if you want your key to expire after a certain period.
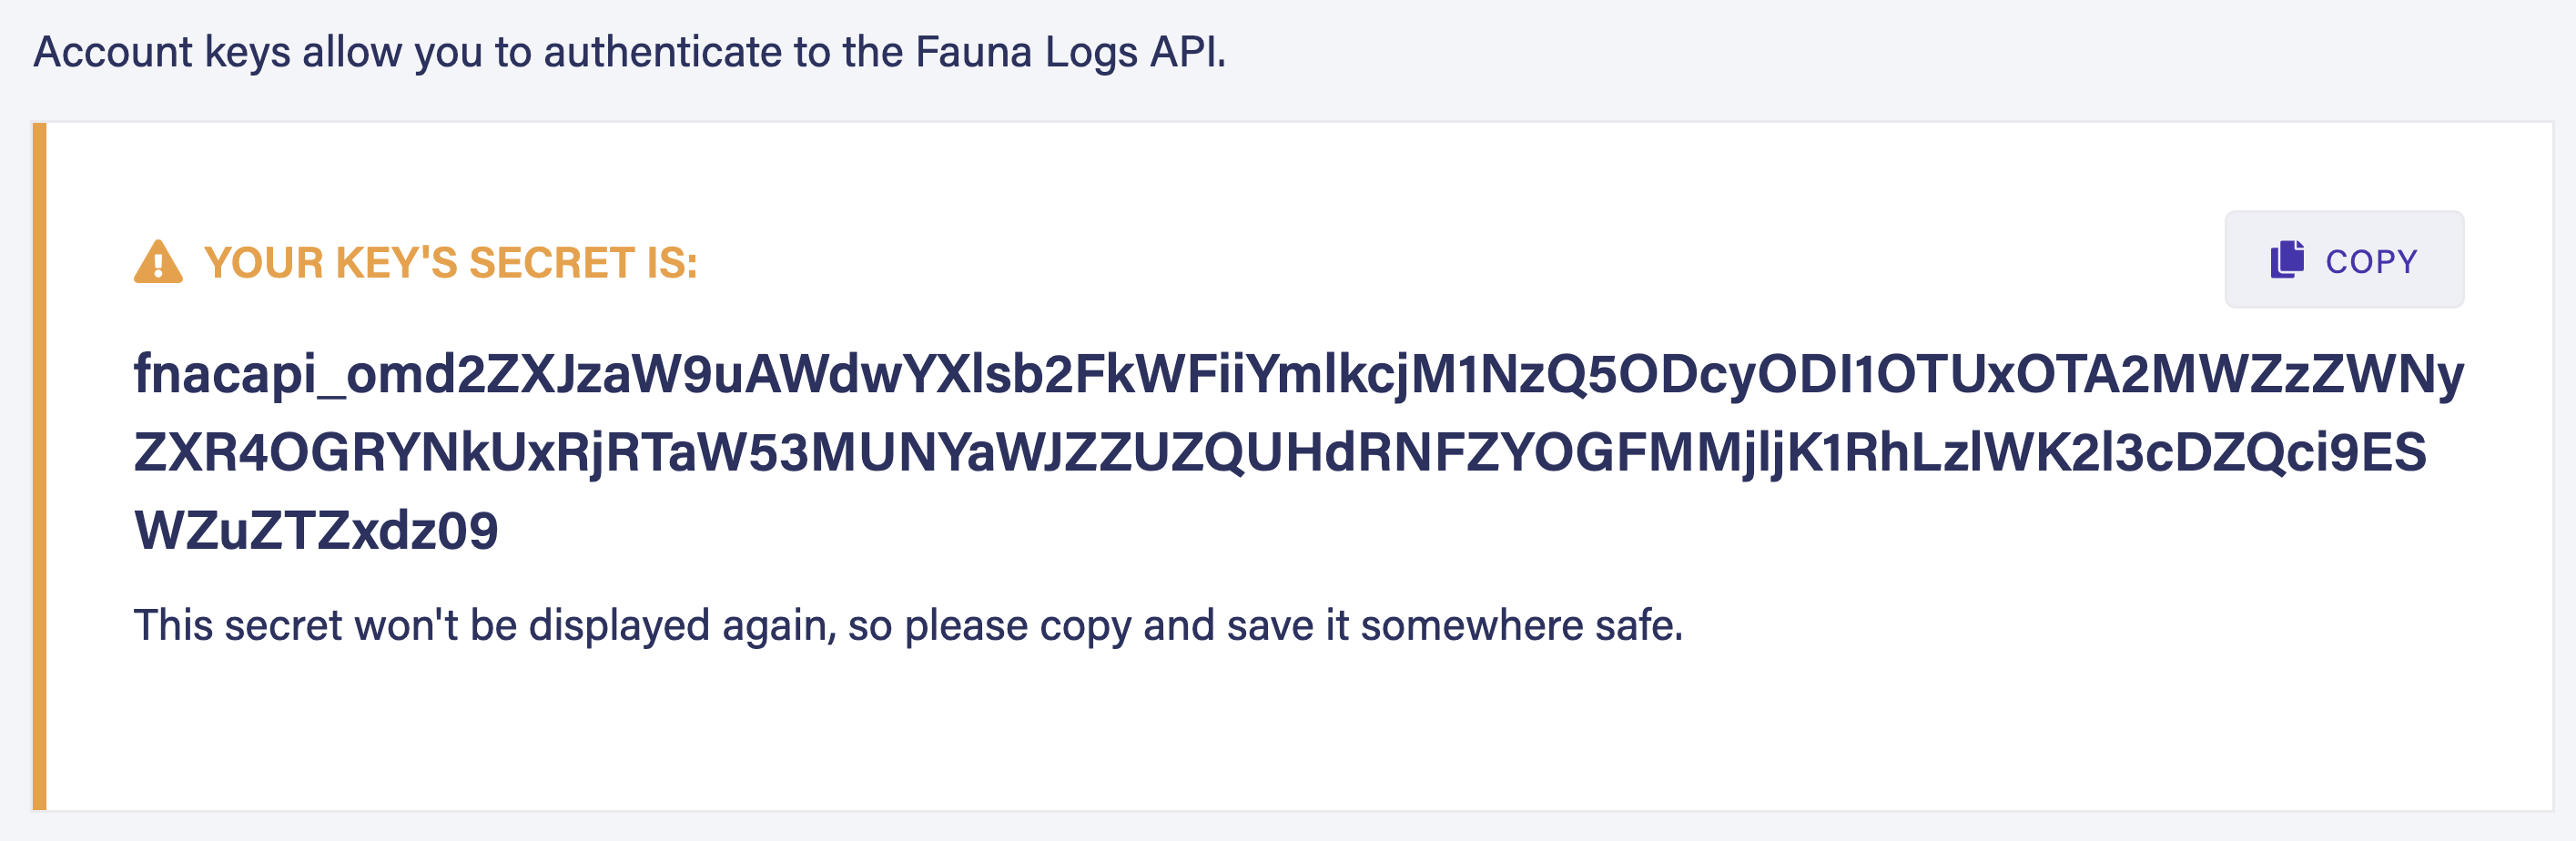
Once you have to account key you can use it to pull the logs programatically using the following Node.js script.
const axios = require('axios').default;
const winston = require('winston');
const lux = require("luxon");

const frontdoorClient = axios.create({
  baseURL: "https://frontdoor.fauna.com",
  timeout: 10000,
});

const logger = winston.createLogger({
  level: 'info',
  format: winston.format.json(),
  defaultMeta: { service: 'querylogs-demo' },
  transports: [
    new winston.transports.Console({
      level: "debug",
      handleExceptions: true,
      // enable json output, good to send to DD
      format: winston.format.json(),
    }),
  ],
});

const today = lux.DateTime.now().toISO();
const yesterday = lux.DateTime.now().minus(lux.Duration.fromISO("P1D")).toISO();

async function getLogs() {
  const headers = { Authorization: `Bearer ${process.env["ACCOUNT_KEY"]}` };
  const { data: querylogRequest } = await frontdoorClient.post(
    "/api/v1/logs?type=query",
    { region_group: "us-std", time_start: yesterday, time_end: today},
    { headers }
  );
  logger.info(querylogRequest);
  await pollResults(querylogRequest, headers, "us-std");
}

if (process.env["ACCOUNT_KEY"] === undefined) {
  logger.error("You must set ACCOUNT_KEY in your local environment to run this program!");
  return;
}

async function pollResults(
  querylogRequest,
  headers,
  region_group,
) {
  let result;
  const maxRuntimeMs = 300 * 1000;
  const time_start = Date.now();
  do {
    ({ data: result } = await frontdoorClient.get(
      `/api/v1/logs/${querylogRequest.request_id}?regionGroup=${region_group}&type=query`,
      { headers }
    ));
    await new Promise((resolve) => setTimeout(resolve, 1000));
    logger.info(`State: ${result.state}`);
  } while (
    Date.now() < time_start + maxRuntimeMs &&
    !(["Complete", "DoesNotExist", "Failed", "TimedOut"].includes(result.state))
  );
  logger.info(result);
  return result;
}

getLogs().then(() => logger.info("Thanks for trying out Fauna logs! Please give us any and all feedback!"));
Next, you can run the following script to upload the
jsonl file to ELK. const axios = require('axios');
const fs = require('fs');
const filePath = '/path/to/your/file.json';
const kibanaUrl = 'http://localhost:5601';
const uploadJsonToKibana = async () => {
try {
const fileData = fs.readFileSync(filePath);
const formData = new FormData();
formData.append('file', fileData, { filename: 'myJsonFile.json' });
const response = await axios.post(`${kibanaUrl}/api/saved_objects/_import`, formData, {
headers: {
'kbn-xsrf': 'true',
'Content-Type': 'multipart/form-data',
},
});
console.log('File uploaded successfully:', response.data);
} catch (error) {
console.error('Error uploading file:', error.message);
}
};
uploadJsonToKibana(); Tagging a query
If you want to tag particular queries for better insights you can do so with the Fauna driver. The following code snippet demonstrates how you can tag a particular query.
client.query(
  q.Paginate(q.Collections()),
  {
		tags: { key1: "value1", key2: "value2" },
  }
)
Tags and associated values must be alphanumeric strings or underscores (_). Tag names can be up to 40 bytes. Tag values can be up to 80 bytes.
Query tags can provide contextual information about the log. For instance, you can tag different queries in your application and determine the most used one. Query tags can give you valuable insights into your application. You can explore which query type sees a spike during a specific time. Let's say you are running an e-commerce site. You may notice a spike in a particular product category during the holiday season. Based on this customer behavior, you can then adapt your application.
Summary
Query logs are important in enterprise software development as they help identify performance issues, debug errors, analyze user behavior, enhance security, and optimize the database. If you are looking for an observability tool for your Fauna databases then the Elastic Stack is a viable option.
The Fauna service will be ending on May 30, 2025. For more information, read the announcement and the FAQ.
Subscribe to Fauna's newsletter
Get latest blog posts, development tips & tricks, and latest learning material delivered right to your inbox.