
Gather insights from Fauna Logs with Datadog, AWS EventBridge, and AWS Lambda
Fauna offers access to database logs (i.e. query time, query activity, and compute usage) through its dashboard. These logs provide valuable insights about your database system's performance, behavior, and usage. You can automate the process of accessing and analyzing these logs.
This blog post guides you through setting up an automated pipeline to ship your application’s database logs to Datadog using an AWS Lambda function and an EventBridge scheduler.
The full source code for this tutorial can be found here.
Currently, Fauna Logs are available for Pro and Enterprise users only.
Pre-requisites:
- Fauna account
- AWS account
- Datadog account
- Node.js installed in your local machine
- Serverless framework installed in your local machine
Architecture
The following diagram demonstrates the architecture of this solution.
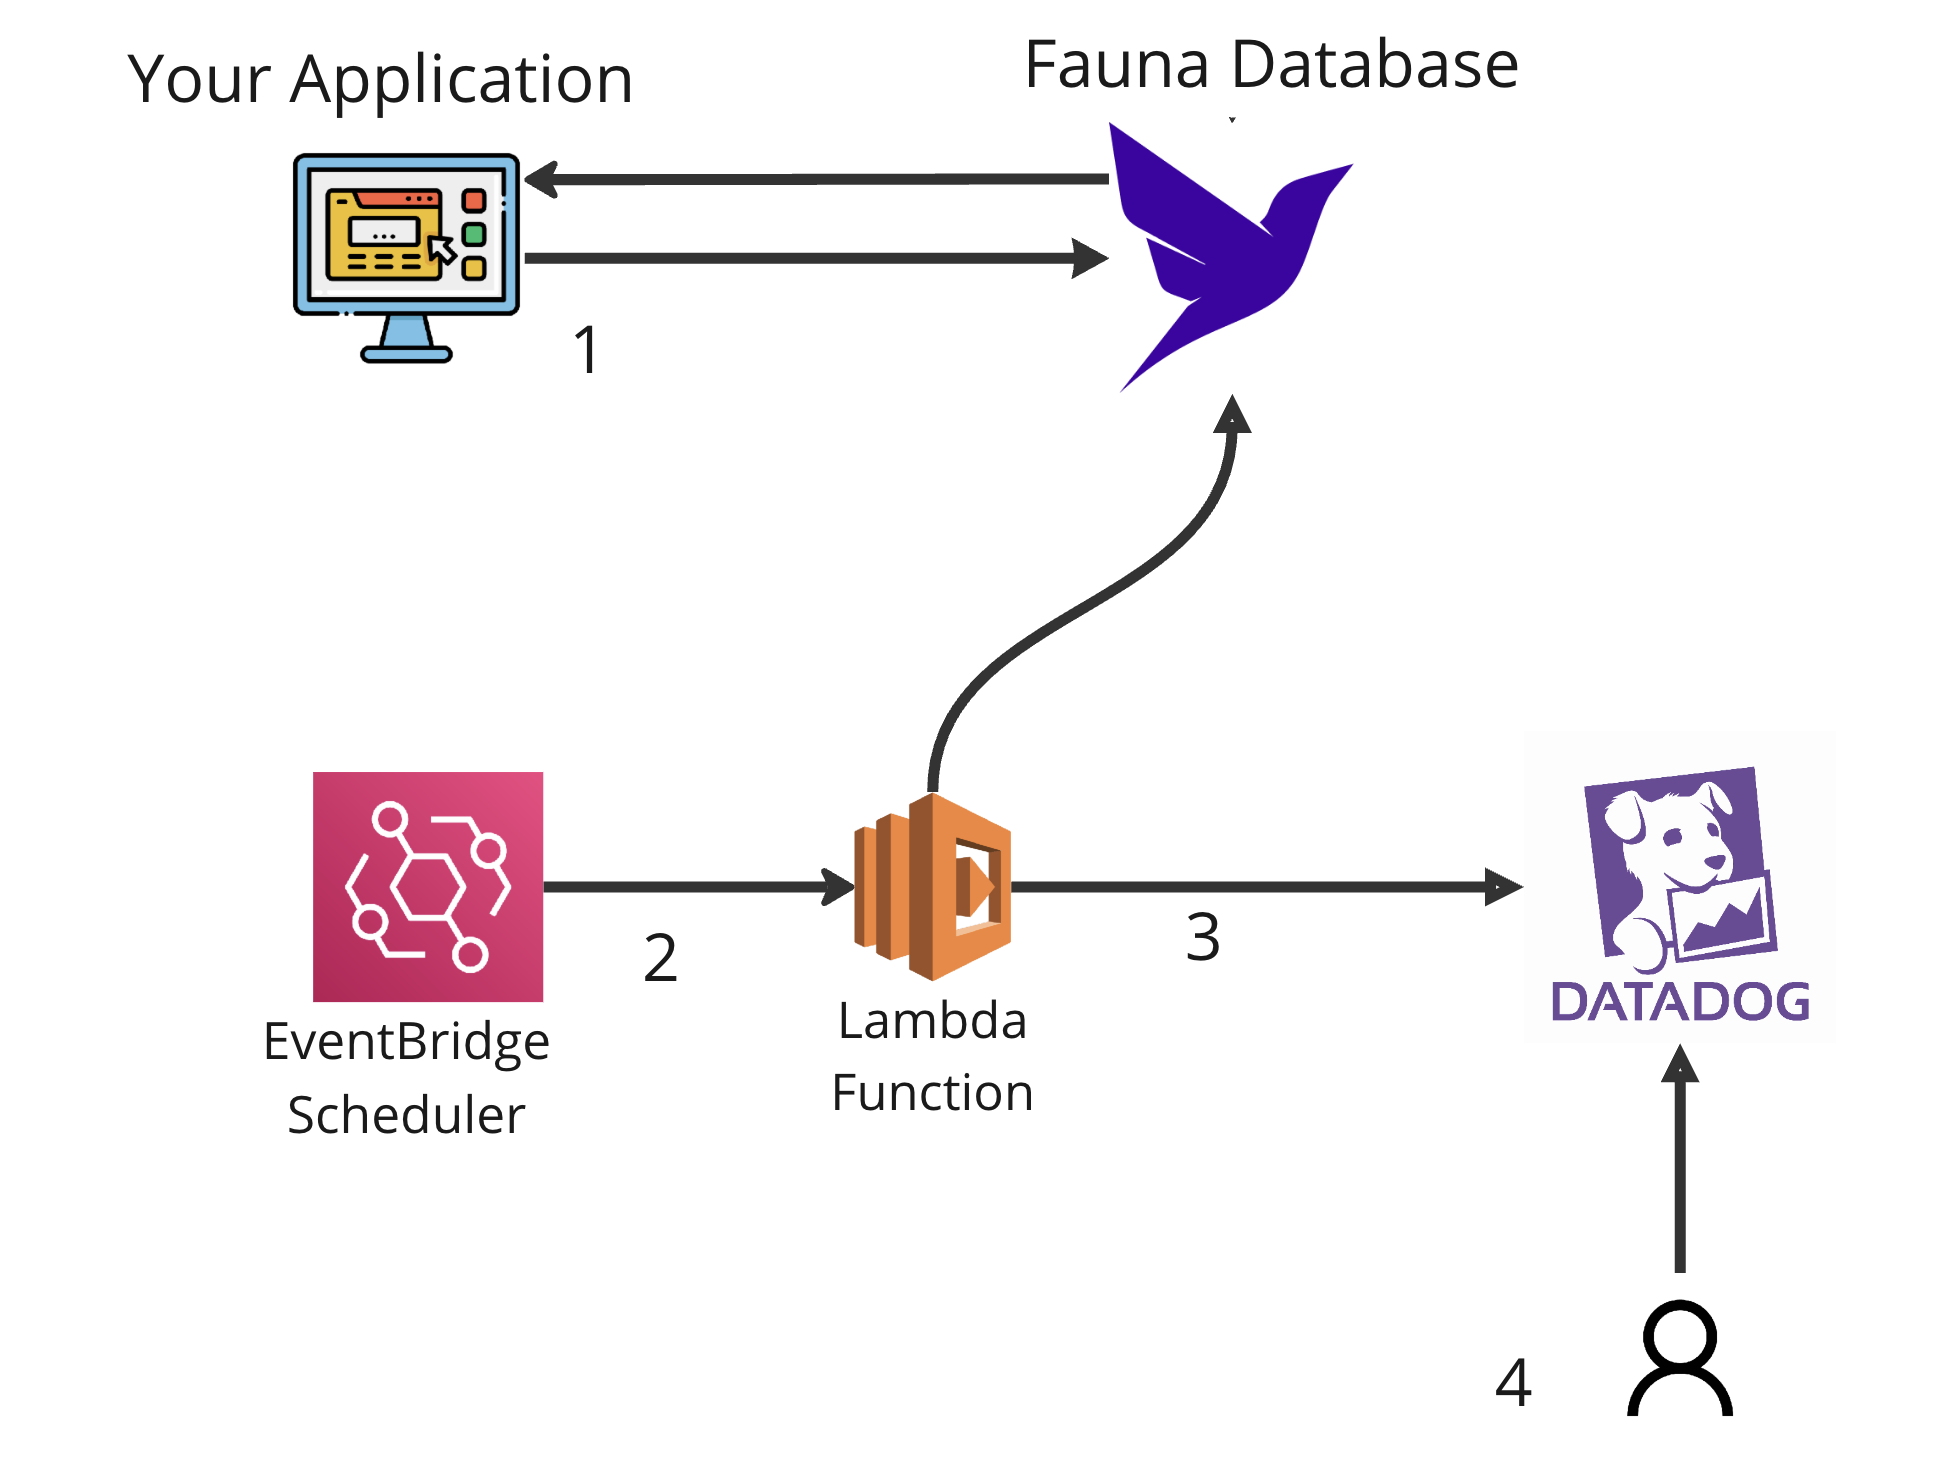
Your application saves and retrieves data from Fauna. To get the database logs, you run a Lambda function using the AWS EventBridge scheduler every 1 hour (you can configure the scheduler to run the Lambda function as frequently as you want). The lambda function calls Fauna, retrieves the database logs, and then ships them to Datadog. You can then gather insights and visualize your database logs in Datadog.
Configure Fauna
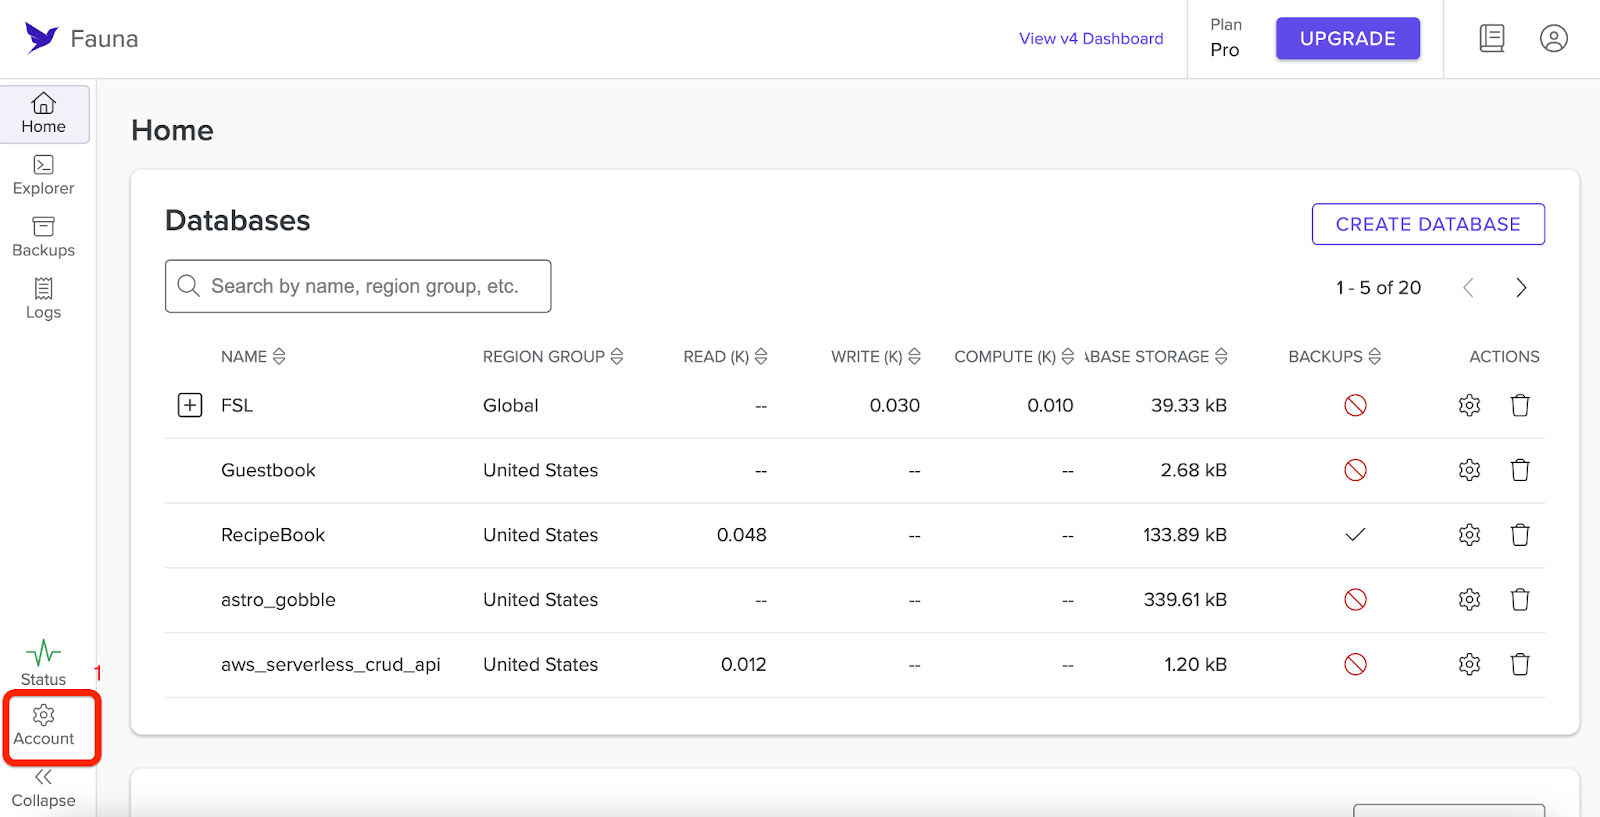
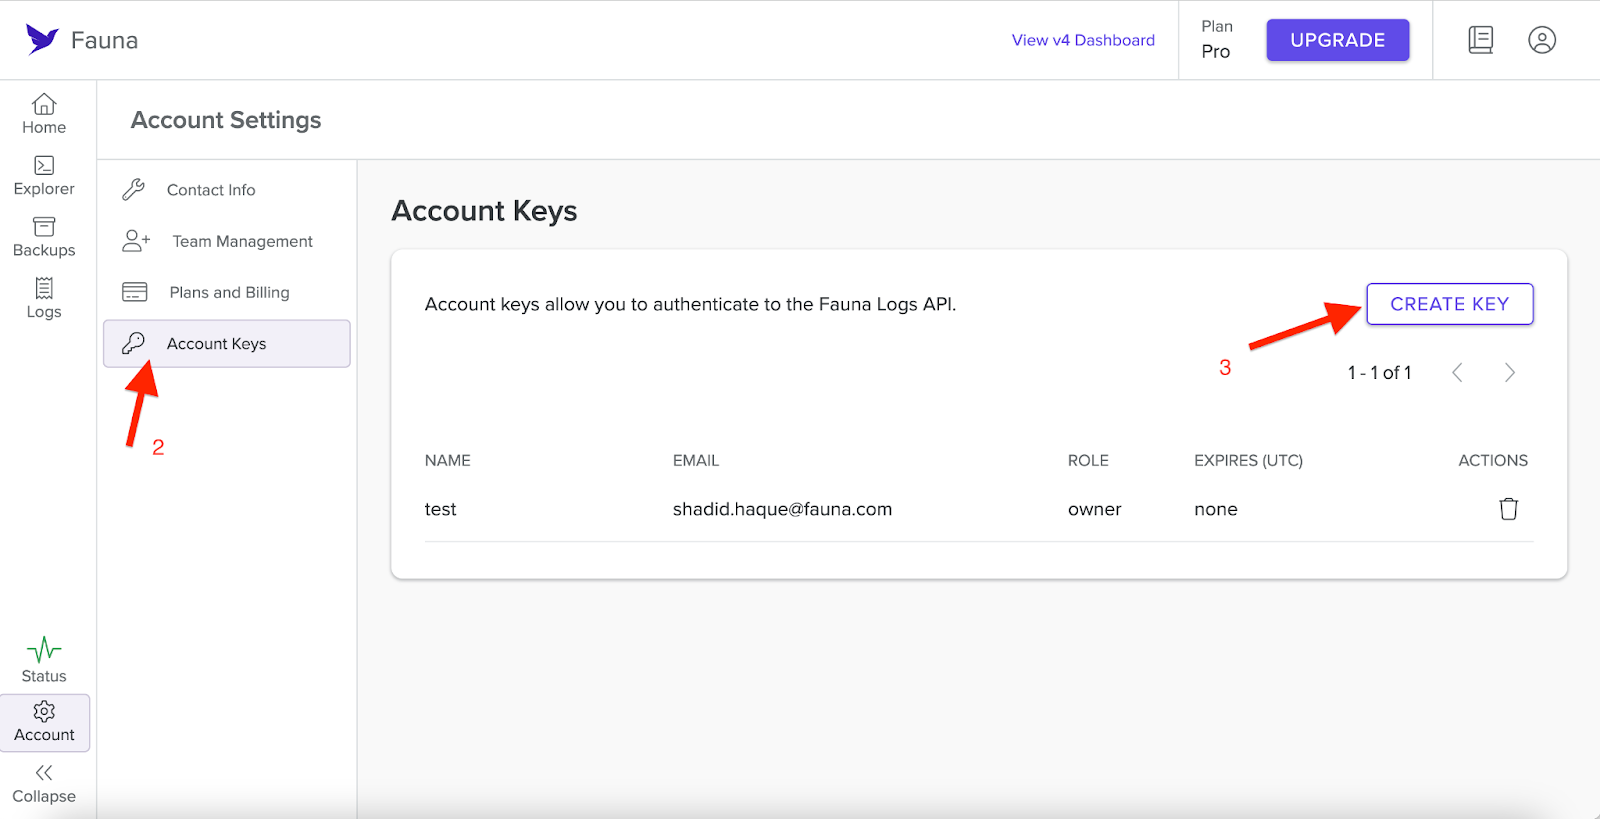
You need a Fauna account key to access Fauna logs. You can generate a new Fauna account key by selecting Account Settings in the bottom left-hand corner of your dashboard. From there, navigate to Account Keys and select Create Keys.
Once you generate the key, save it.
Configure Datadog
Go to your Datadog account and get your application key. Follow this article to retrieve your application key.
If you don't have a Datadog account you can signup for a free account.
Setting up your project
Create a new directory called
mylogs and change the directory into the folder. $ mkdir mylogs
$ cd mylogsAdd the required dependencies for your project by running the following command.
$ npm i —save serverless \
  serverless-dotenv-plugin \
  fauna \
  luxon \
  axios
Next create a
.env file and add your Fauna account key and Datadog API key. # .env
FAUNA_ACCOUNT_KEY=<Your-Fauna-Account-Key>
DATADOG_API_KEY=<Datadog-API-key>Setting up EventBridge Scheduled Lambda with Serverless framework
Create a new file called serverless.yml in the root of your project. Add the contents from this file to your serverless.yml file.
Let's begin by examining the serverless.yml file. This configuration file defines the AWS Lambda function, its runtime, and the EventBridge scheduler trigger. EventBridge schedules the lambda function execution.
Below is a breakdown of the essential components:
service: FaunaLogsToDatadog  # Replace with your desired service name

provider:
 name: aws
 runtime: nodejs18.x  # Adjust as needed

functions:
 myLambdaFunction:
   handler: index.handler  # Assuming your handler is in index.js and named 'handler'
   events:
     - schedule:
         rate: rate(1 hour)  # Replace with your desired schedule expression, currently set to run once every hour
plugins:
 - serverless-dotenv-plugin
 - serverless-offline
custom:
 dotenv:
   path: .env  # Specify the path to your .env file containing environment variables
Here, we specify the AWS Lambda function, set its runtime to whichever version of Node.js you prefer, here we use Node.js 18.x, and configure the EventBridge scheduler to trigger the function every hour. You can adjust the rate parameter as needed to suit your specific scheduling requirements.
Adding the AWS Lambda Function code
The heart of our automation lies in the Lambda function defined in
index.js. Create a new file called index.js and add the code from this file in our repository. This function utilizes the Fauna Account/Admin API (i.e. https://account.fauna.com/) to retrieve query logs within a specified time range. The two key functions here are
getLogs and pollResults. Let's explore the key components of the script:getLogs is the engine that drives the interaction with Fauna, initiating the retrieval of logs based on a defined time range. First, we pass our Fauna account key into the header. const headers = { Authorization: `Bearer ${process.env["ACCOUNT_KEY"]}` };Next, since the EventBridge was set up to run the Lambda function every hour in the .yml file, it makes sense to collect information from the last hour in the Fauna database as well to avoid doubling up on our data log results; however feel free to change the date to suit your needs.
       // Get the current time
       const currentTime = new Date();

       // Calculate one hour ago from the current time
       const oneHourAgo = new Date(currentTime.getTime() - 60 * 60 * 1000);

       // Format the dates in ISO 8601 format
       const timeStart = oneHourAgo.toISOString();
       const timeEnd = currentTime.toISOString();

       const { data: querylogRequest } = await faunaClient.post(
           "/api/v1/logs?type=query",
           {
               region_group: "us-std",
               time_start: timeStart,
               time_end: timeEnd,
               database: "us-std/random_numbers"
           },
           { headers }
       );
       await pollResults(querylogRequest, headers, "us-std");
Notice that we are passing in region_group, time_start, time_end, and, last but not least, the database you want to get logs for. Consider the following regarding your own database: \
1) If you do not include a database you will receive results for all the databases in your account.
2) If your database is in the Global region then your region_group should be set to “classic” and your database would be set to “classic/<name of database>” and if your database is in the Europe region then your region_group should be set to “eu-std” and your database to “eu-std/<name of database>”.
Next, we call the
pollResults function. async function pollResults(
querylogRequest,
headers,
region_group,
) {
let result;
const maxRuntimeMs = 300 * 1000;
const time_start = Date.now();
do {
({ data: result } = await faunaClient.get(
`/api/v1/logs/${querylogRequest.request_id}?regionGroup=${region_group}&type=query`,
{ headers }
));
await new Promise((resolve) => setTimeout(resolve, 1000));
console.log(`State: ${result.state}`);
} while (
Date.now() < time_start + maxRuntimeMs &&
!(["Complete", "DoesNotExist", "Failed", "TimedOut"].includes(result.state))
);
console.log("Result:", result);The
pollResults function oversees the polling and processing of the Fauna query log results as well as ensures they are formatted and sent to Datadog. Above, the function checks the status of the log processing and waits for the result to reach a state of completion, non-existence, failure, or timeout.The resulting data log from Fauna will be received as a presigned_url in the format of a compressed gzip file. To send it to Datadog it needs to be decompressed, and formatted into a stringified JSON array.
     // Fetching data from the presigned URL
     if (result.state === 'Complete' && result.presigned_url) {
         try {
             const response = await axios.get(result.presigned_url, { responseType: 'arraybuffer' });

             // Decompressing the gzip data
             const decompressedData = zlib.gunzipSync(response.data).toString('utf8');

             // Splitting the JSONL content into individual JSON objects
             const jsonObjects = decompressedData.split('\n');

             // Filter and parse valid JSON objects
             const jsonArray = jsonObjects.filter(Boolean).map(obj => {
                 try {
                     return JSON.parse(obj.trim());
                 } catch (error) {
                     console.error(`Error parsing JSON object: ${error}`);
                     return null;
                 }
             }).filter(Boolean); // Remove any potential null values as DataDog may throw an error

             // Stringify the JSON array
             const jsonData = JSON.stringify(jsonArray);
We then make an API call to Datadog to forward the JSON array with our database information.
             const apiKey = process.env.DATADOG_API_KEY;
             const datadogUrl = `https://http-intake.logs.datadoghq.com/api/v2/logs?dd-api-key=${apiKey}`;

             // Prepare headers
             const headers = {
                 'Content-Type': 'application/json',
             };

             // Send the JSON array as a whole to Datadog
             await fetch(datadogUrl, {
                 method: 'POST',
                 headers: headers,
                 body: jsonData,
             })
             console.log('Data sent to DataDog');
         } catch (error) {
             console.error(`Error fetching or decompressing data from presigned URL: ${error}`);
         }
At this point we can check the Datadog dashboard to verify that the data has been received.
To wrap up, ensure you deploy your code using sls deploy.
$ sls deployWith this, your database information will now be consistently sent from Fauna to Datadog every hour or whichever time interval you have decided to use.
Observing the logs in Datadog
In the example code we set up the lambda code so that it sends logs from the last hour and EventBridge scheduler runs the Lambda function every hour. The logs populates for every hour.
Login to your Datadog account and in the dashboard select Logs in the left-hand menu. From here you can view the logs from your Fauna database.
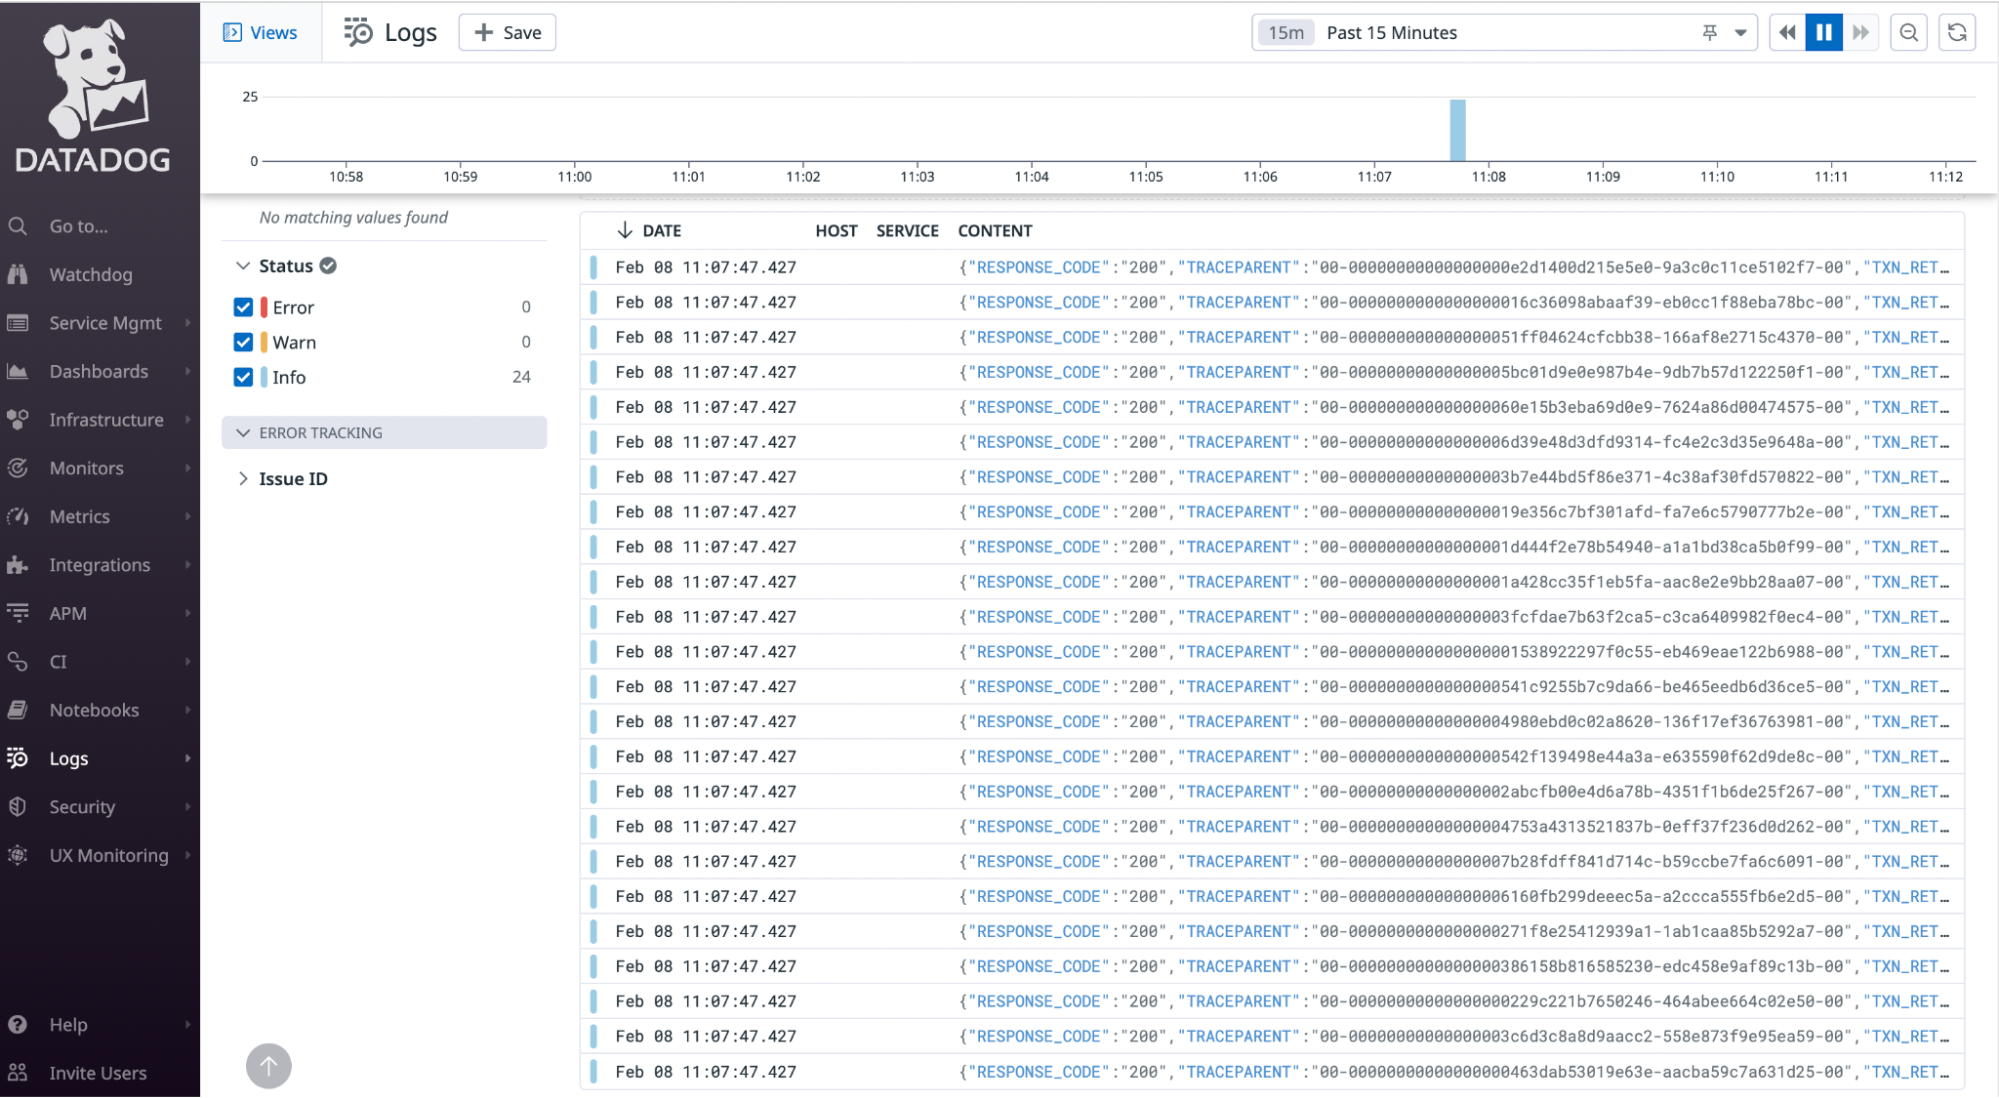
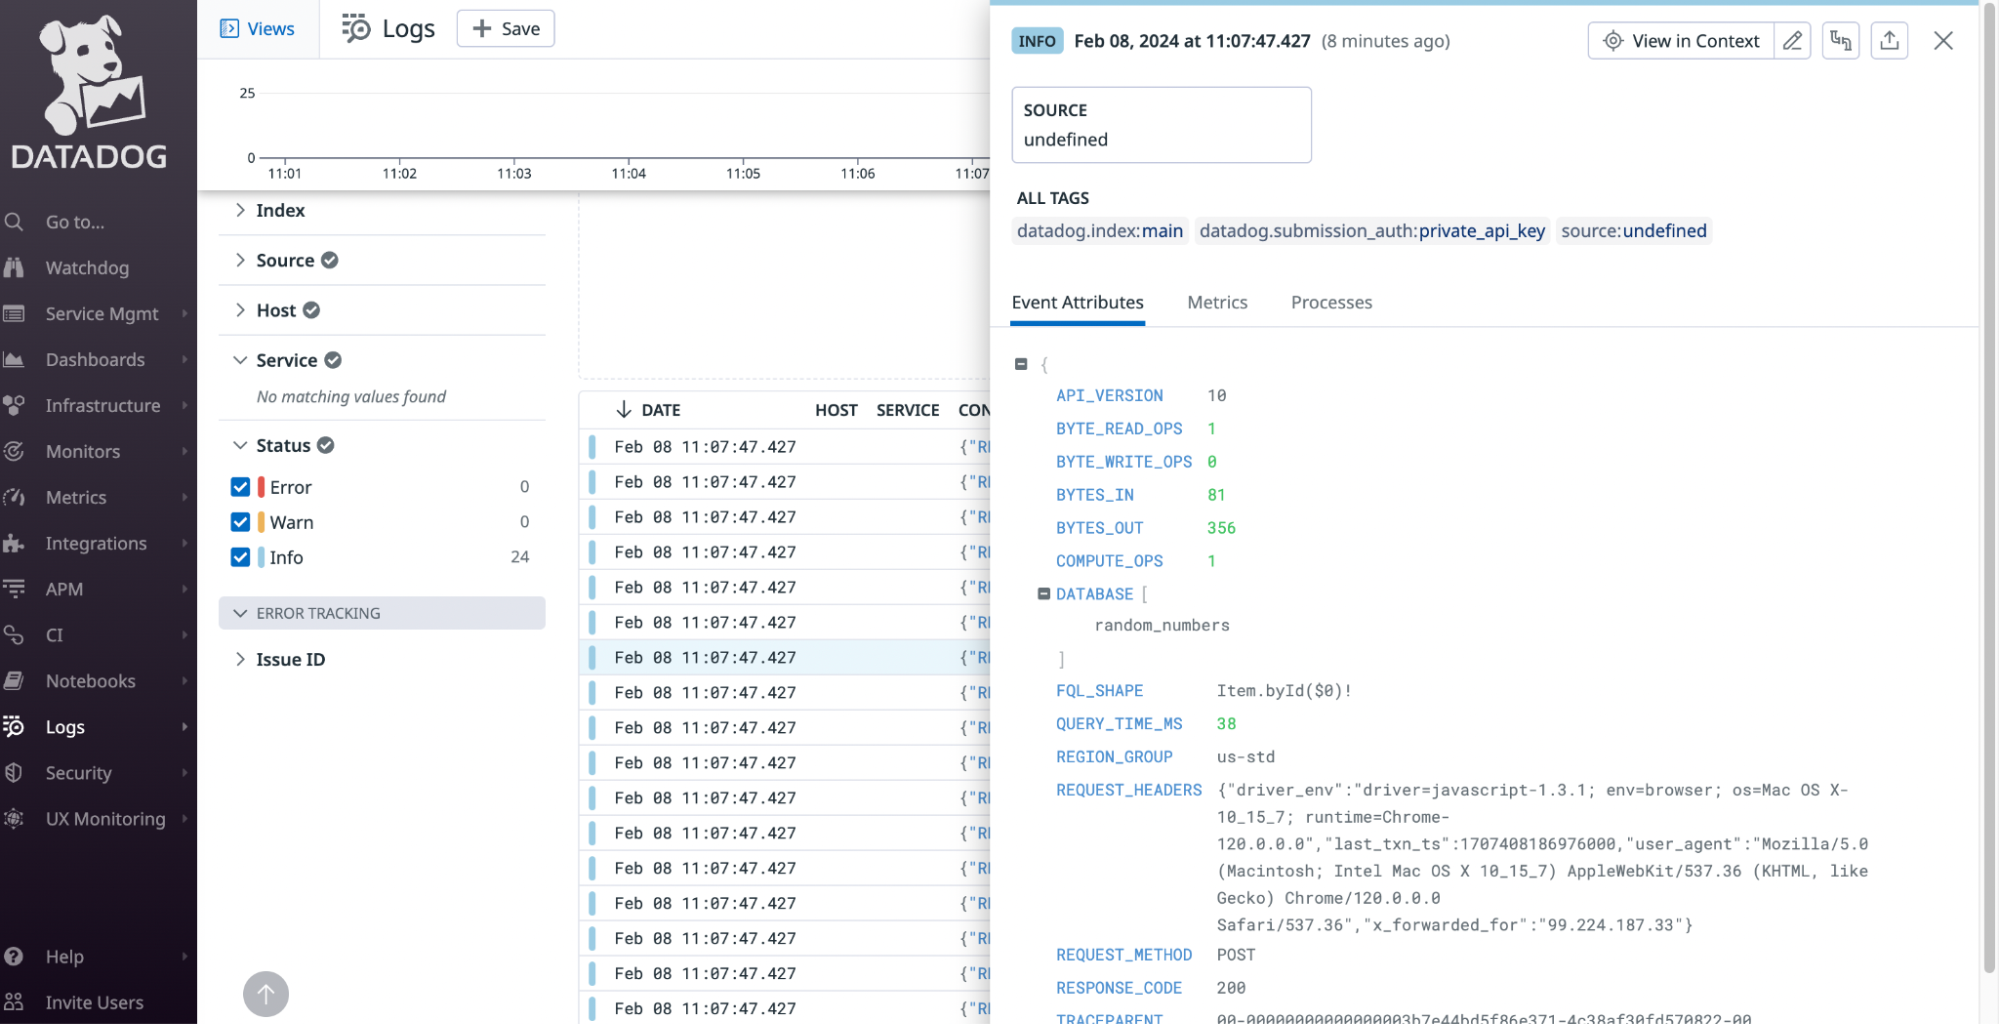
Each log can be opened to view additional details.
Cleanup
If you wish to turn off this functionality it must be done through AWS EventBridge and Lambda in the AWS console.
You can also delete the entire stack with the Serverless framework by running the following command.
$ sls removeConclusion
With the conclusion of this step-by-step guide you are now equipped to automate Fauna log analysis using Datadog and AWS Lambda and set up a streamlined pipeline for collecting and visualizing valuable insights into your database's performance and usage. You have flexibility in deciding the frequency of data collection and which databases you retrieve. As you deploy this solution make sure you keep in mind the methods for turning off the functionality when needed.
The full source code can be found here.
The Fauna service will be ending on May 30, 2025. For more information, read the announcement and the FAQ.
Subscribe to Fauna's newsletter
Get latest blog posts, development tips & tricks, and latest learning material delivered right to your inbox.